Guamanian/Chamorro vs Immigrants from Sudan Associate's Degree
COMPARE
Guamanian/Chamorro
Immigrants from Sudan
Associate's Degree
Associate's Degree Comparison
Guamanians/Chamorros
Immigrants from Sudan
43.8%
ASSOCIATE'S DEGREE
4.8/ 100
METRIC RATING
225th/ 347
METRIC RANK
47.4%
ASSOCIATE'S DEGREE
77.9/ 100
METRIC RATING
146th/ 347
METRIC RANK
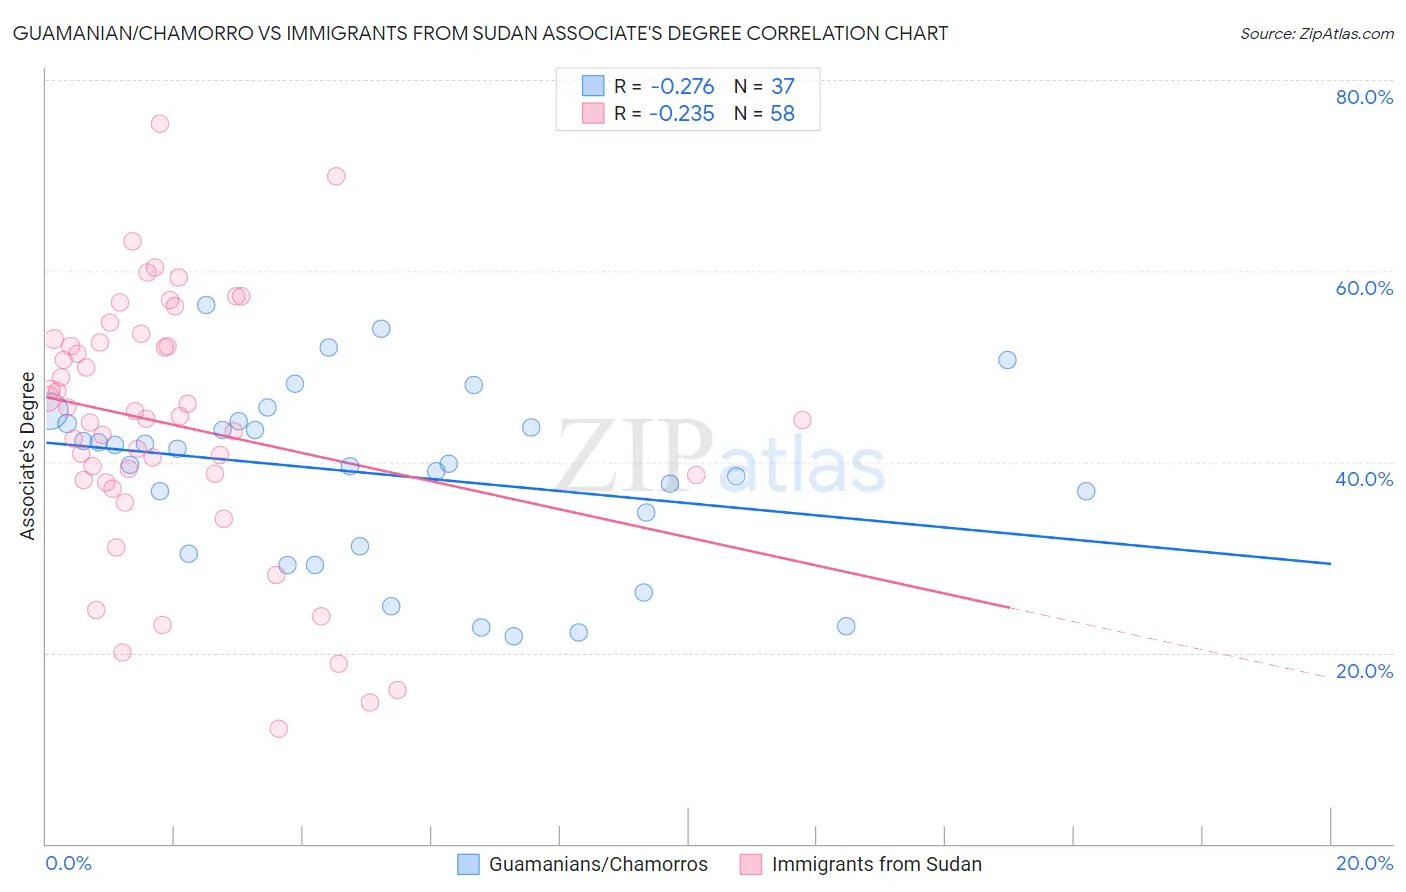
Guamanian/Chamorro vs Immigrants from Sudan Associate's Degree Correlation Chart
The statistical analysis conducted on geographies consisting of 221,965,027 people shows a weak negative correlation between the proportion of Guamanians/Chamorros and percentage of population with at least associate's degree education in the United States with a correlation coefficient (R) of -0.276 and weighted average of 43.8%. Similarly, the statistical analysis conducted on geographies consisting of 118,972,993 people shows a weak negative correlation between the proportion of Immigrants from Sudan and percentage of population with at least associate's degree education in the United States with a correlation coefficient (R) of -0.235 and weighted average of 47.4%, a difference of 8.4%.
Associate's Degree Correlation Summary
| Measurement | Guamanian/Chamorro | Immigrants from Sudan |
| Minimum | 21.7% | 12.1% |
| Maximum | 56.4% | 75.4% |
| Range | 34.7% | 63.3% |
| Mean | 38.7% | 43.8% |
| Median | 39.8% | 44.7% |
| Interquartile 25% (IQ1) | 30.8% | 38.1% |
| Interquartile 75% (IQ3) | 44.1% | 52.5% |
| Interquartile Range (IQR) | 13.4% | 14.4% |
| Standard Deviation (Sample) | 9.2% | 13.4% |
| Standard Deviation (Population) | 9.1% | 13.3% |
Similar Demographics by Associate's Degree
Demographics Similar to Guamanians/Chamorros by Associate's Degree
In terms of associate's degree, the demographic groups most similar to Guamanians/Chamorros are West Indian (43.8%, a difference of 0.15%), Immigrants from Burma/Myanmar (43.7%, a difference of 0.22%), Subsaharan African (43.9%, a difference of 0.29%), Barbadian (43.9%, a difference of 0.39%), and Trinidadian and Tobagonian (43.6%, a difference of 0.39%).
| Demographics | Rating | Rank | Associate's Degree |
| Spanish | 9.4 /100 | #218 | Tragic 44.4% |
| Whites/Caucasians | 7.5 /100 | #219 | Tragic 44.2% |
| Portuguese | 7.2 /100 | #220 | Tragic 44.1% |
| Immigrants | Western Africa | 6.6 /100 | #221 | Tragic 44.1% |
| Barbadians | 5.8 /100 | #222 | Tragic 43.9% |
| Sub-Saharan Africans | 5.5 /100 | #223 | Tragic 43.9% |
| West Indians | 5.2 /100 | #224 | Tragic 43.8% |
| Guamanians/Chamorros | 4.8 /100 | #225 | Tragic 43.8% |
| Immigrants | Burma/Myanmar | 4.3 /100 | #226 | Tragic 43.7% |
| Trinidadians and Tobagonians | 4.0 /100 | #227 | Tragic 43.6% |
| Hmong | 3.2 /100 | #228 | Tragic 43.4% |
| Immigrants | Trinidad and Tobago | 3.0 /100 | #229 | Tragic 43.3% |
| Immigrants | Barbados | 2.9 /100 | #230 | Tragic 43.3% |
| Liberians | 2.9 /100 | #231 | Tragic 43.3% |
| Native Hawaiians | 2.3 /100 | #232 | Tragic 43.1% |
Demographics Similar to Immigrants from Sudan by Associate's Degree
In terms of associate's degree, the demographic groups most similar to Immigrants from Sudan are Danish (47.4%, a difference of 0.050%), South American Indian (47.4%, a difference of 0.12%), Canadian (47.5%, a difference of 0.13%), Immigrants from Armenia (47.4%, a difference of 0.13%), and Iraqi (47.4%, a difference of 0.17%).
| Demographics | Rating | Rank | Associate's Degree |
| Slovenes | 85.1 /100 | #139 | Excellent 47.9% |
| Immigrants | Southern Europe | 84.4 /100 | #140 | Excellent 47.8% |
| Taiwanese | 83.3 /100 | #141 | Excellent 47.7% |
| Sierra Leoneans | 82.9 /100 | #142 | Excellent 47.7% |
| Norwegians | 81.0 /100 | #143 | Excellent 47.6% |
| Slavs | 80.5 /100 | #144 | Excellent 47.6% |
| Canadians | 79.0 /100 | #145 | Good 47.5% |
| Immigrants | Sudan | 77.9 /100 | #146 | Good 47.4% |
| Danes | 77.3 /100 | #147 | Good 47.4% |
| South American Indians | 76.7 /100 | #148 | Good 47.4% |
| Immigrants | Armenia | 76.6 /100 | #149 | Good 47.4% |
| Iraqis | 76.2 /100 | #150 | Good 47.4% |
| Immigrants | North Macedonia | 76.0 /100 | #151 | Good 47.4% |
| Immigrants | Afghanistan | 74.3 /100 | #152 | Good 47.3% |
| Czechs | 72.2 /100 | #153 | Good 47.2% |