Guamanian/Chamorro vs Immigrants from Jordan No Vehicles in Household

COMPARE

Guamanian/Chamorro
Race
Ancestry
AfghanAfricanAlaska NativeAlaskan AthabascanAlbanianAleutAlsatianAmericanApacheArabArapahoArgentineanArmenianAssyrian/Chaldean/SyriacAustralianAustrianBahamianBangladeshiBarbadianBasqueBelgianBelizeanBermudanBhutaneseBlackfeetBolivianBrazilianBritishBritish West IndianBulgarianBurmeseCajunCambodianCanadianCape VerdeanCarpatho RusynCelticCentral AmericanCentral American IndianCherokeeCheyenneChickasawChileanChineseChippewaChoctawColombianColvilleComancheCosta RicanCreeCreekCroatianCrowCubanCypriotCzechCzechoslovakianDanishDelawareDominicanDutchDutch West IndianEastern EuropeanEcuadorianEgyptianEnglishEstonianEthiopianEuropeanFijianFilipinoFinnishFrenchFrench American IndianFrench CanadianGermanGerman RussianGhanaianGreekGuamanian/ChamorroGuatemalanGuyaneseHaitianHmongHonduranHopiHoumaHungarianIcelanderIndian (Asian)IndonesianInupiatIranianIraqiIrishIroquoisIsraeliItalianJamaicanJapaneseJordanianKenyanKiowaKoreanLaotianLatvianLebaneseLiberianLithuanianLumbeeLuxembourgerMacedonianMalaysianMalteseMarshalleseMenomineeMexicanMexican American IndianMongolianMoroccanNative HawaiianNavajoNepaleseNew ZealanderNicaraguanNigerianNorthern EuropeanNorwegianOkinawanOsageOttawaPaiutePakistaniPalestinianPanamanianParaguayanPennsylvania GermanPeruvianPimaPolishPortuguesePotawatomiPuebloPuerto RicanPuget Sound SalishRomanianRussianSalvadoranSamoanScandinavianScotch-IrishScottishSeminoleSenegaleseSerbianShoshoneSierra LeoneanSiouxSlavicSlovakSloveneSomaliSouth AfricanSouth AmericanSouth American IndianSoviet UnionSpaniardSpanishSpanish AmericanSpanish American IndianSri LankanSubsaharan AfricanSudaneseSwedishSwissSyrianTaiwaneseThaiTlingit-HaidaTohono O'OdhamTonganTrinidadian and TobagonianTsimshianTurkishU.S. Virgin IslanderUgandanUkrainianUruguayanUteVenezuelanVietnameseWelshWest IndianYakamaYaquiYugoslavianYumanYup'ikZimbabwean
Immigration
NonimmigrantsImmigrantsAfghanistanAfricaAlbaniaArgentinaArmeniaAsiaAustraliaAustriaBahamasBangladeshBarbadosBelarusBelgiumBelizeBoliviaBosnia and HerzegovinaBrazilBulgariaBurma/MyanmarCabo VerdeCambodiaCameroonCanadaCaribbeanCentral AmericaChileChinaColombiaCongoCosta RicaCroatiaCubaCzechoslovakiaDenmarkDominicaDominican RepublicEastern AfricaEastern AsiaEastern EuropeEcuadorEgyptEl SalvadorEnglandEritreaEthiopiaEuropeFijiFranceGermanyGhanaGreeceGrenadaGuatemalaGuyanaHaitiHondurasHong KongHungaryIndiaIndonesiaIranIraqIrelandIsraelItalyJamaicaJapanKazakhstanKenyaKoreaKuwaitLaosLatin AmericaLatviaLebanonLiberiaLithuaniaMalaysiaMexicoMicronesiaMiddle AfricaMoldovaMoroccoNepalNetherlandsNicaraguaNigeriaNorth AmericaNorth MacedoniaNorthern AfricaNorthern EuropeNorwayOceaniaPakistanPanamaPeruPhilippinesPolandPortugalRomaniaRussiaSaudi ArabiaScotlandSenegalSerbiaSierra LeoneSingaporeSomaliaSouth AfricaSouth AmericaSouth Central AsiaSouth Eastern AsiaSouthern EuropeSpainSri LankaSt. Vincent and the GrenadinesSudanSwedenSwitzerlandSyriaTaiwanThailandTrinidad and TobagoTurkeyUgandaUkraineUruguayUzbekistanVenezuelaVietnamWest IndiesWestern AfricaWestern AsiaWestern EuropeYemenZaireZimbabweAzores
Immigrants from Jordan
Race
Ancestry
AfghanAfricanAlaska NativeAlaskan AthabascanAlbanianAleutAlsatianAmericanApacheArabArapahoArgentineanArmenianAssyrian/Chaldean/SyriacAustralianAustrianBahamianBangladeshiBarbadianBasqueBelgianBelizeanBermudanBhutaneseBlackfeetBolivianBrazilianBritishBritish West IndianBulgarianBurmeseCajunCambodianCanadianCape VerdeanCarpatho RusynCelticCentral AmericanCentral American IndianCherokeeCheyenneChickasawChileanChineseChippewaChoctawColombianColvilleComancheCosta RicanCreeCreekCroatianCrowCubanCypriotCzechCzechoslovakianDanishDelawareDominicanDutchDutch West IndianEastern EuropeanEcuadorianEgyptianEnglishEstonianEthiopianEuropeanFijianFilipinoFinnishFrenchFrench American IndianFrench CanadianGermanGerman RussianGhanaianGreekGuatemalanGuyaneseHaitianHmongHonduranHopiHoumaHungarianIcelanderIndian (Asian)IndonesianInupiatIranianIraqiIrishIroquoisIsraeliItalianJamaicanJapaneseJordanianKenyanKiowaKoreanLaotianLatvianLebaneseLiberianLithuanianLumbeeLuxembourgerMacedonianMalaysianMalteseMarshalleseMenomineeMexicanMexican American IndianMongolianMoroccanNative HawaiianNavajoNepaleseNew ZealanderNicaraguanNigerianNorthern EuropeanNorwegianOkinawanOsageOttawaPaiutePakistaniPalestinianPanamanianParaguayanPennsylvania GermanPeruvianPimaPolishPortuguesePotawatomiPuebloPuerto RicanPuget Sound SalishRomanianRussianSalvadoranSamoanScandinavianScotch-IrishScottishSeminoleSenegaleseSerbianShoshoneSierra LeoneanSiouxSlavicSlovakSloveneSomaliSouth AfricanSouth AmericanSouth American IndianSoviet UnionSpaniardSpanishSpanish AmericanSpanish American IndianSri LankanSubsaharan AfricanSudaneseSwedishSwissSyrianTaiwaneseThaiTlingit-HaidaTohono O'OdhamTonganTrinidadian and TobagonianTsimshianTurkishU.S. Virgin IslanderUgandanUkrainianUruguayanUteVenezuelanVietnameseWelshWest IndianYakamaYaquiYugoslavianYumanYup'ikZimbabwean
Immigration
NonimmigrantsImmigrantsAfghanistanAfricaAlbaniaArgentinaArmeniaAsiaAustraliaAustriaBahamasBangladeshBarbadosBelarusBelgiumBelizeBoliviaBosnia and HerzegovinaBrazilBulgariaBurma/MyanmarCabo VerdeCambodiaCameroonCanadaCaribbeanCentral AmericaChileChinaColombiaCongoCosta RicaCroatiaCubaCzechoslovakiaDenmarkDominicaDominican RepublicEastern AfricaEastern AsiaEastern EuropeEcuadorEgyptEl SalvadorEnglandEritreaEthiopiaEuropeFijiFranceGermanyGhanaGreeceGrenadaGuatemalaGuyanaHaitiHondurasHong KongHungaryIndiaIndonesiaIranIraqIrelandIsraelItalyJamaicaJapanJordanKazakhstanKenyaKoreaKuwaitLaosLatin AmericaLatviaLebanonLiberiaLithuaniaMalaysiaMexicoMicronesiaMiddle AfricaMoldovaMoroccoNepalNetherlandsNicaraguaNigeriaNorth AmericaNorth MacedoniaNorthern AfricaNorthern EuropeNorwayOceaniaPakistanPanamaPeruPhilippinesPolandPortugalRomaniaRussiaSaudi ArabiaScotlandSenegalSerbiaSierra LeoneSingaporeSomaliaSouth AfricaSouth AmericaSouth Central AsiaSouth Eastern AsiaSouthern EuropeSpainSri LankaSt. Vincent and the GrenadinesSudanSwedenSwitzerlandSyriaTaiwanThailandTrinidad and TobagoTurkeyUgandaUkraineUruguayUzbekistanVenezuelaVietnamWest IndiesWestern AfricaWestern AsiaWestern EuropeYemenZaireZimbabweAzores
No Vehicles in Household
Income
Poverty
Unemployment
Labor Participation
Family Structure
Vehicle Availability
Education Level
Disability

No Vehicles in Household Comparison

Guamanians/Chamorros

Immigrants from Jordan

Exceptional
Exceptional
8.0%
NO VEHICLES IN HOUSEHOLD
99.9/ 100
METRIC RATING
49th/ 347
METRIC RANK
8.7%
NO VEHICLES IN HOUSEHOLD
99.3/ 100
METRIC RATING
84th/ 347
METRIC RANK

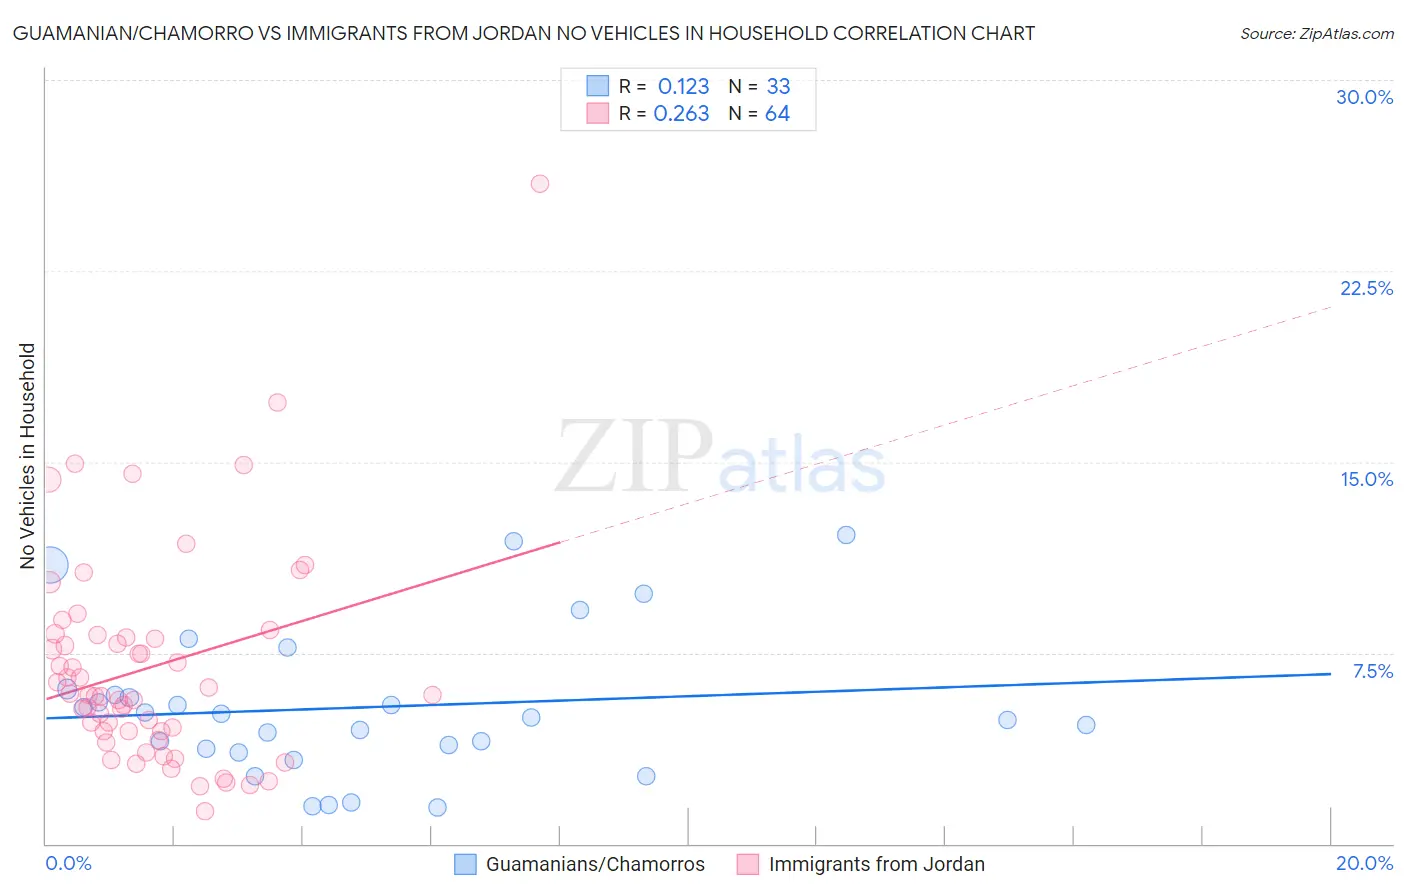
Guamanian/Chamorro vs Immigrants from Jordan No Vehicles in Household Correlation Chart

The statistical analysis conducted on geographies consisting of 221,696,459 people shows a poor positive correlation between the proportion of Guamanians/Chamorros and percentage of households with no vehicle available in the United States with a correlation coefficient (R) of 0.123 and weighted average of 8.0%. Similarly, the statistical analysis conducted on geographies consisting of 181,152,945 people shows a weak positive correlation between the proportion of Immigrants from Jordan and percentage of households with no vehicle available in the United States with a correlation coefficient (R) of 0.263 and weighted average of 8.7%, a difference of 8.4%.
Guamanian/Chamorro vs Immigrants from Jordan No Vehicles in Household

No Vehicles in Household Correlation Summary

MeasurementGuamanian/ChamorroImmigrants from Jordan
Minimum1.4%1.3%
Maximum12.1%25.9%
Range10.7%24.6%
Mean5.4%6.9%
Median5.0%5.9%
Interquartile 25% (IQ1)3.7%4.4%
Interquartile 75% (IQ3)6.0%8.1%
Interquartile Range (IQR)2.3%3.7%
Standard Deviation (Sample)2.9%4.2%
Standard Deviation (Population)2.8%4.2%

Similar Demographics by No Vehicles in Household

Demographics Similar to Guamanians/Chamorros by No Vehicles in Household

In terms of no vehicles in household, the demographic groups most similar to Guamanians/Chamorros are Belgian (8.0%, a difference of 0.070%), Afghan (8.0%, a difference of 0.17%), Korean (8.0%, a difference of 0.17%), Northern European (7.9%, a difference of 0.65%), and Hawaiian (8.0%, a difference of 0.75%).
DemographicsRating | RankNo Vehicles in Household
Swiss
99.9
/100
|
#42
Exceptional
7.9%
Chickasaw
99.9
/100
|
#43
Exceptional
7.9%
Choctaw
99.9
/100
|
#44
Exceptional
7.9%
Immigrants | Nonimmigrants
99.9
/100
|
#45
Exceptional
7.9%
Spanish
99.9
/100
|
#46
Exceptional
7.9%
Northern Europeans
99.9
/100
|
#47
Exceptional
7.9%
Afghans
99.9
/100
|
#48
Exceptional
8.0%
Guamanians/Chamorros
99.9
/100
|
#49
Exceptional
8.0%
Belgians
99.9
/100
|
#50
Exceptional
8.0%
Koreans
99.9
/100
|
#51
Exceptional
8.0%
Hawaiians
99.9
/100
|
#52
Exceptional
8.0%
Slovenes
99.9
/100
|
#53
Exceptional
8.0%
Immigrants | Venezuela
99.9
/100
|
#54
Exceptional
8.1%
Celtics
99.9
/100
|
#55
Exceptional
8.1%
Immigrants | Afghanistan
99.9
/100
|
#56
Exceptional
8.1%

Demographics Similar to Immigrants from Jordan by No Vehicles in Household

In terms of no vehicles in household, the demographic groups most similar to Immigrants from Jordan are Lebanese (8.7%, a difference of 0.060%), Bangladeshi (8.7%, a difference of 0.16%), Italian (8.6%, a difference of 0.25%), Immigrants from England (8.7%, a difference of 0.39%), and Osage (8.7%, a difference of 0.51%).
DemographicsRating | RankNo Vehicles in Household
Iranians
99.5
/100
|
#77
Exceptional
8.6%
Immigrants | South Central Asia
99.5
/100
|
#78
Exceptional
8.6%
Portuguese
99.5
/100
|
#79
Exceptional
8.6%
Bolivians
99.4
/100
|
#80
Exceptional
8.6%
Tsimshian
99.4
/100
|
#81
Exceptional
8.6%
Immigrants | South Eastern Asia
99.4
/100
|
#82
Exceptional
8.6%
Italians
99.4
/100
|
#83
Exceptional
8.6%
Immigrants | Jordan
99.3
/100
|
#84
Exceptional
8.7%
Lebanese
99.3
/100
|
#85
Exceptional
8.7%
Bangladeshis
99.3
/100
|
#86
Exceptional
8.7%
Immigrants | England
99.2
/100
|
#87
Exceptional
8.7%
Osage
99.2
/100
|
#88
Exceptional
8.7%
Immigrants | Cuba
99.2
/100
|
#89
Exceptional
8.7%
Bhutanese
99.2
/100
|
#90
Exceptional
8.7%
Immigrants | Germany
99.1
/100
|
#91
Exceptional
8.7%