Guamanian/Chamorro vs Ghanaian No Vehicles in Household
COMPARE
Guamanian/Chamorro
Ghanaian
No Vehicles in Household
No Vehicles in Household Comparison
Guamanians/Chamorros
Ghanaians
8.0%
NO VEHICLES IN HOUSEHOLD
99.9/ 100
METRIC RATING
49th/ 347
METRIC RANK
16.4%
NO VEHICLES IN HOUSEHOLD
0.0/ 100
METRIC RATING
316th/ 347
METRIC RANK
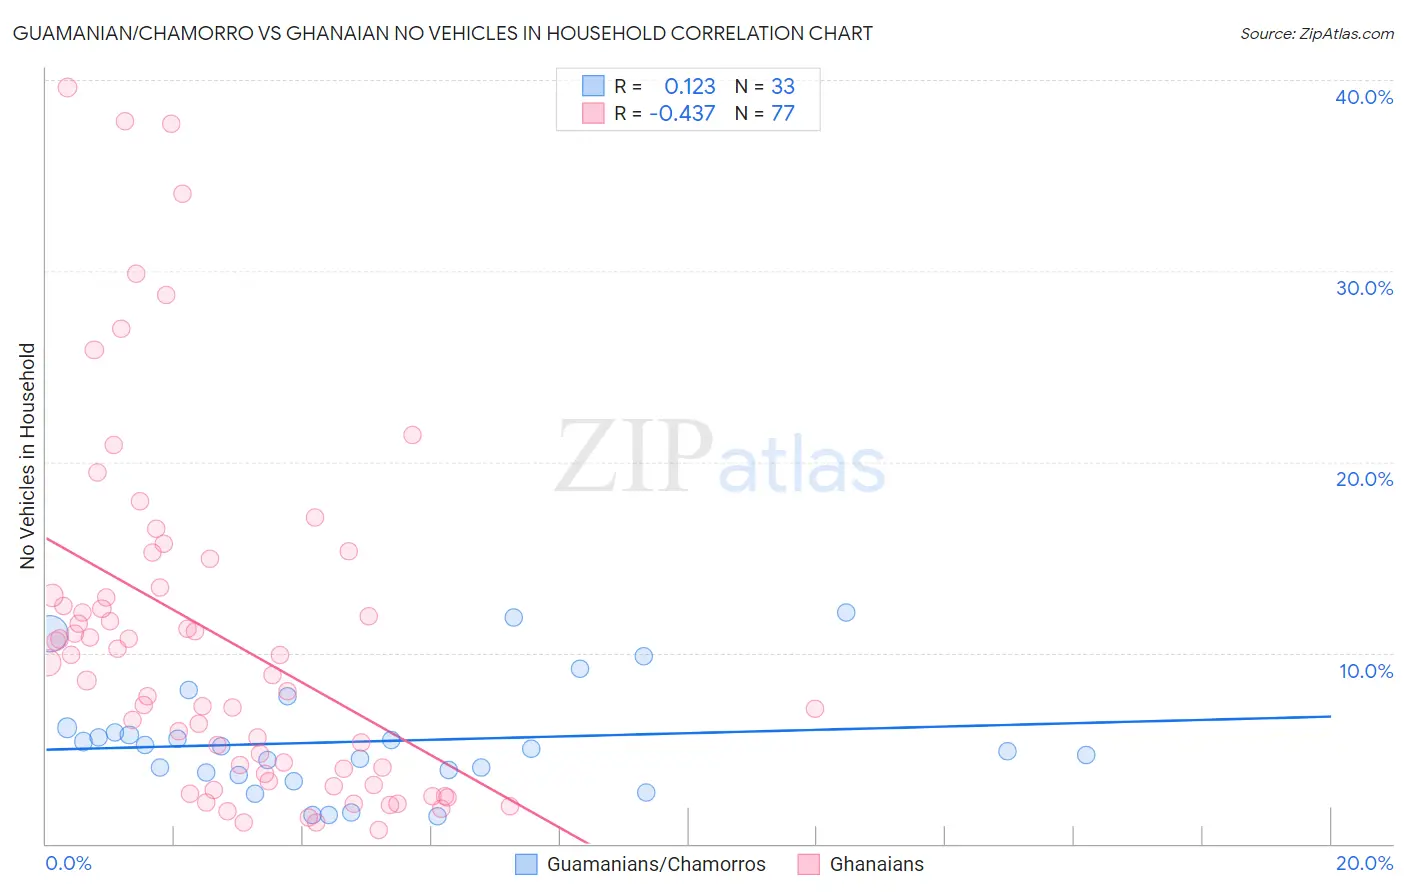
Guamanian/Chamorro vs Ghanaian No Vehicles in Household Correlation Chart
The statistical analysis conducted on geographies consisting of 221,696,459 people shows a poor positive correlation between the proportion of Guamanians/Chamorros and percentage of households with no vehicle available in the United States with a correlation coefficient (R) of 0.123 and weighted average of 8.0%. Similarly, the statistical analysis conducted on geographies consisting of 190,166,774 people shows a moderate negative correlation between the proportion of Ghanaians and percentage of households with no vehicle available in the United States with a correlation coefficient (R) of -0.437 and weighted average of 16.4%, a difference of 106.0%.
No Vehicles in Household Correlation Summary
| Measurement | Guamanian/Chamorro | Ghanaian |
| Minimum | 1.4% | 0.75% |
| Maximum | 12.1% | 39.6% |
| Range | 10.7% | 38.9% |
| Mean | 5.4% | 10.7% |
| Median | 5.0% | 8.9% |
| Interquartile 25% (IQ1) | 3.7% | 3.5% |
| Interquartile 75% (IQ3) | 6.0% | 13.2% |
| Interquartile Range (IQR) | 2.3% | 9.7% |
| Standard Deviation (Sample) | 2.9% | 9.2% |
| Standard Deviation (Population) | 2.8% | 9.2% |
Similar Demographics by No Vehicles in Household
Demographics Similar to Guamanians/Chamorros by No Vehicles in Household
In terms of no vehicles in household, the demographic groups most similar to Guamanians/Chamorros are Belgian (8.0%, a difference of 0.070%), Afghan (8.0%, a difference of 0.17%), Korean (8.0%, a difference of 0.17%), Northern European (7.9%, a difference of 0.65%), and Hawaiian (8.0%, a difference of 0.75%).
| Demographics | Rating | Rank | No Vehicles in Household |
| Swiss | 99.9 /100 | #42 | Exceptional 7.9% |
| Chickasaw | 99.9 /100 | #43 | Exceptional 7.9% |
| Choctaw | 99.9 /100 | #44 | Exceptional 7.9% |
| Immigrants | Nonimmigrants | 99.9 /100 | #45 | Exceptional 7.9% |
| Spanish | 99.9 /100 | #46 | Exceptional 7.9% |
| Northern Europeans | 99.9 /100 | #47 | Exceptional 7.9% |
| Afghans | 99.9 /100 | #48 | Exceptional 8.0% |
| Guamanians/Chamorros | 99.9 /100 | #49 | Exceptional 8.0% |
| Belgians | 99.9 /100 | #50 | Exceptional 8.0% |
| Koreans | 99.9 /100 | #51 | Exceptional 8.0% |
| Hawaiians | 99.9 /100 | #52 | Exceptional 8.0% |
| Slovenes | 99.9 /100 | #53 | Exceptional 8.0% |
| Immigrants | Venezuela | 99.9 /100 | #54 | Exceptional 8.1% |
| Celtics | 99.9 /100 | #55 | Exceptional 8.1% |
| Immigrants | Afghanistan | 99.9 /100 | #56 | Exceptional 8.1% |
Demographics Similar to Ghanaians by No Vehicles in Household
In terms of no vehicles in household, the demographic groups most similar to Ghanaians are Immigrants from Ghana (16.6%, a difference of 0.95%), Immigrants from Belarus (16.7%, a difference of 1.8%), Cypriot (15.7%, a difference of 5.0%), Albanian (15.6%, a difference of 5.1%), and Tohono O'odham (15.6%, a difference of 5.3%).
| Demographics | Rating | Rank | No Vehicles in Household |
| Puerto Ricans | 0.0 /100 | #309 | Tragic 15.5% |
| Cape Verdeans | 0.0 /100 | #310 | Tragic 15.6% |
| Immigrants | Israel | 0.0 /100 | #311 | Tragic 15.6% |
| Alaskan Athabascans | 0.0 /100 | #312 | Tragic 15.6% |
| Tohono O'odham | 0.0 /100 | #313 | Tragic 15.6% |
| Albanians | 0.0 /100 | #314 | Tragic 15.6% |
| Cypriots | 0.0 /100 | #315 | Tragic 15.7% |
| Ghanaians | 0.0 /100 | #316 | Tragic 16.4% |
| Immigrants | Ghana | 0.0 /100 | #317 | Tragic 16.6% |
| Immigrants | Belarus | 0.0 /100 | #318 | Tragic 16.7% |
| Alaska Natives | 0.0 /100 | #319 | Tragic 17.4% |
| Soviet Union | 0.0 /100 | #320 | Tragic 17.4% |
| Jamaicans | 0.0 /100 | #321 | Tragic 17.9% |
| Immigrants | Cabo Verde | 0.0 /100 | #322 | Tragic 18.4% |
| Immigrants | Yemen | 0.0 /100 | #323 | Tragic 19.5% |