Immigrants from Mexico vs Immigrants from Philippines No Vehicles in Household
COMPARE
Immigrants from Mexico
Immigrants from Philippines
No Vehicles in Household
No Vehicles in Household Comparison
Immigrants from Mexico
Immigrants from Philippines
8.1%
NO VEHICLES IN HOUSEHOLD
99.8/ 100
METRIC RATING
58th/ 347
METRIC RANK
8.5%
NO VEHICLES IN HOUSEHOLD
99.5/ 100
METRIC RATING
76th/ 347
METRIC RANK
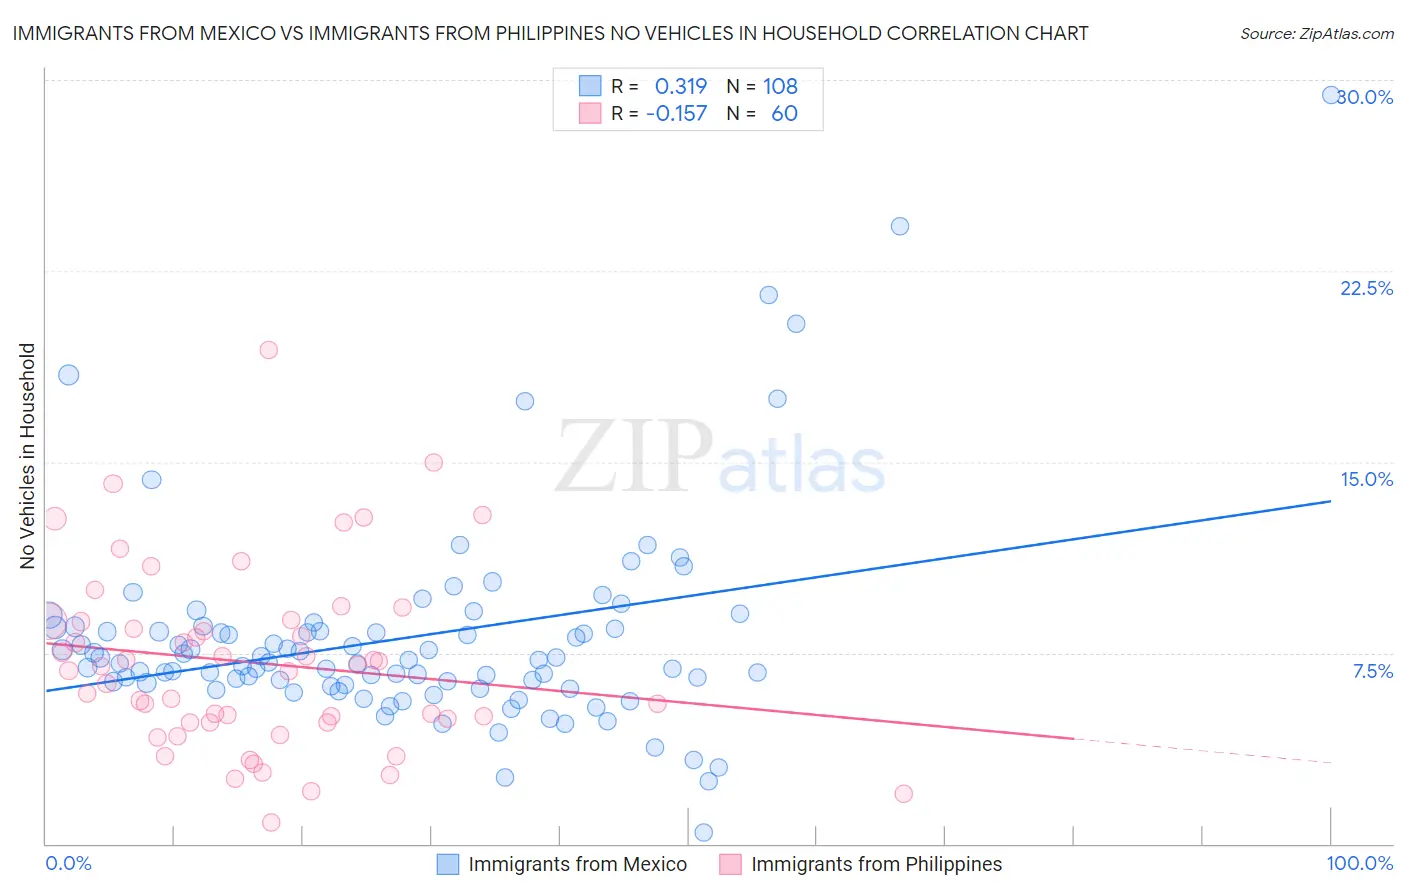
Immigrants from Mexico vs Immigrants from Philippines No Vehicles in Household Correlation Chart
The statistical analysis conducted on geographies consisting of 510,868,339 people shows a mild positive correlation between the proportion of Immigrants from Mexico and percentage of households with no vehicle available in the United States with a correlation coefficient (R) of 0.319 and weighted average of 8.1%. Similarly, the statistical analysis conducted on geographies consisting of 469,724,480 people shows a poor negative correlation between the proportion of Immigrants from Philippines and percentage of households with no vehicle available in the United States with a correlation coefficient (R) of -0.157 and weighted average of 8.5%, a difference of 5.1%.
No Vehicles in Household Correlation Summary
| Measurement | Immigrants from Mexico | Immigrants from Philippines |
| Minimum | 0.44% | 0.84% |
| Maximum | 29.4% | 19.4% |
| Range | 29.0% | 18.6% |
| Mean | 8.1% | 7.1% |
| Median | 7.2% | 6.9% |
| Interquartile 25% (IQ1) | 6.3% | 4.8% |
| Interquartile 75% (IQ3) | 8.5% | 8.7% |
| Interquartile Range (IQR) | 2.2% | 4.0% |
| Standard Deviation (Sample) | 4.1% | 3.6% |
| Standard Deviation (Population) | 4.1% | 3.6% |
Demographics Similar to Immigrants from Mexico and Immigrants from Philippines by No Vehicles in Household
In terms of no vehicles in household, the demographic groups most similar to Immigrants from Mexico are Venezuelan (8.1%, a difference of 0.11%), Immigrants from India (8.2%, a difference of 0.35%), Immigrants from Laos (8.2%, a difference of 0.42%), Thai (8.2%, a difference of 0.59%), and Chinese (8.2%, a difference of 1.1%). Similarly, the demographic groups most similar to Immigrants from Philippines are Iranian (8.6%, a difference of 0.090%), Jordanian (8.5%, a difference of 0.24%), Cuban (8.5%, a difference of 0.46%), Polish (8.4%, a difference of 1.3%), and Lithuanian (8.4%, a difference of 1.3%).
| Demographics | Rating | Rank | No Vehicles in Household |
| Venezuelans | 99.8 /100 | #57 | Exceptional 8.1% |
| Immigrants | Mexico | 99.8 /100 | #58 | Exceptional 8.1% |
| Immigrants | India | 99.8 /100 | #59 | Exceptional 8.2% |
| Immigrants | Laos | 99.8 /100 | #60 | Exceptional 8.2% |
| Thais | 99.8 /100 | #61 | Exceptional 8.2% |
| Chinese | 99.8 /100 | #62 | Exceptional 8.2% |
| Slovaks | 99.8 /100 | #63 | Exceptional 8.3% |
| Croatians | 99.8 /100 | #64 | Exceptional 8.3% |
| Canadians | 99.7 /100 | #65 | Exceptional 8.3% |
| Palestinians | 99.7 /100 | #66 | Exceptional 8.3% |
| Immigrants | Scotland | 99.7 /100 | #67 | Exceptional 8.3% |
| Immigrants | Iran | 99.7 /100 | #68 | Exceptional 8.4% |
| Spaniards | 99.7 /100 | #69 | Exceptional 8.4% |
| Cajuns | 99.6 /100 | #70 | Exceptional 8.4% |
| Immigrants | Lebanon | 99.6 /100 | #71 | Exceptional 8.4% |
| Lithuanians | 99.6 /100 | #72 | Exceptional 8.4% |
| Poles | 99.6 /100 | #73 | Exceptional 8.4% |
| Cubans | 99.5 /100 | #74 | Exceptional 8.5% |
| Jordanians | 99.5 /100 | #75 | Exceptional 8.5% |
| Immigrants | Philippines | 99.5 /100 | #76 | Exceptional 8.5% |
| Iranians | 99.5 /100 | #77 | Exceptional 8.6% |