Guamanian/Chamorro vs Immigrants from Philippines Seniors Poverty Over the Age of 65
COMPARE
Guamanian/Chamorro
Immigrants from Philippines
Seniors Poverty Over the Age of 65
Seniors Poverty Over the Age of 65 Comparison
Guamanians/Chamorros
Immigrants from Philippines
10.5%
SENIORS POVERTY OVER THE AGE OF 65
87.5/ 100
METRIC RATING
133rd/ 347
METRIC RANK
10.4%
SENIORS POVERTY OVER THE AGE OF 65
89.4/ 100
METRIC RATING
125th/ 347
METRIC RANK
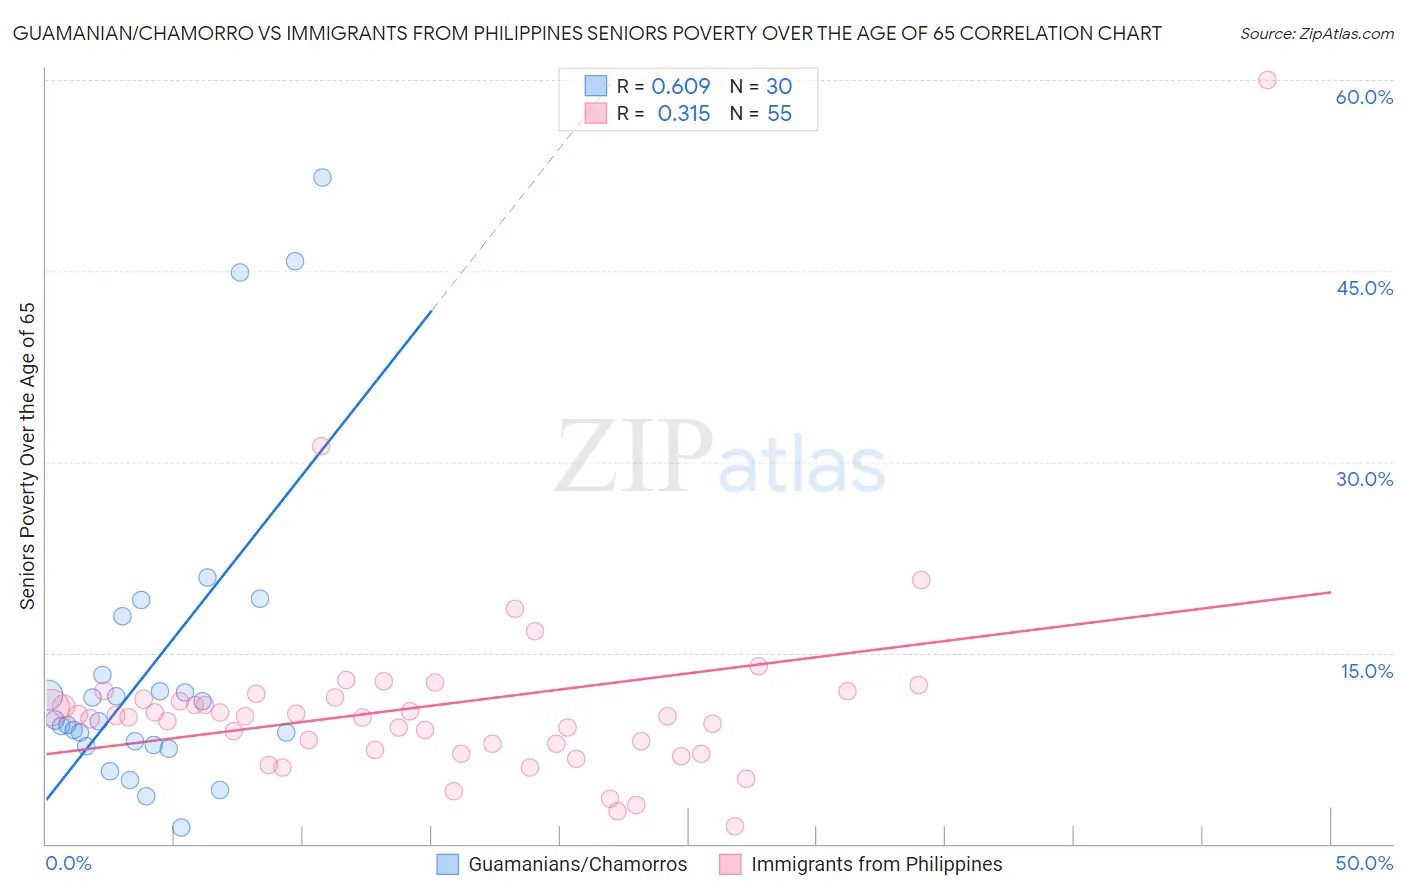
Guamanian/Chamorro vs Immigrants from Philippines Seniors Poverty Over the Age of 65 Correlation Chart
The statistical analysis conducted on geographies consisting of 221,115,754 people shows a significant positive correlation between the proportion of Guamanians/Chamorros and poverty level among seniors over the age of 65 in the United States with a correlation coefficient (R) of 0.609 and weighted average of 10.5%. Similarly, the statistical analysis conducted on geographies consisting of 469,103,257 people shows a mild positive correlation between the proportion of Immigrants from Philippines and poverty level among seniors over the age of 65 in the United States with a correlation coefficient (R) of 0.315 and weighted average of 10.4%, a difference of 0.42%.
Seniors Poverty Over the Age of 65 Correlation Summary
| Measurement | Guamanian/Chamorro | Immigrants from Philippines |
| Minimum | 1.2% | 1.3% |
| Maximum | 52.4% | 60.0% |
| Range | 51.1% | 58.7% |
| Mean | 13.9% | 10.8% |
| Median | 9.7% | 10.0% |
| Interquartile 25% (IQ1) | 7.7% | 7.4% |
| Interquartile 75% (IQ3) | 13.2% | 11.5% |
| Interquartile Range (IQR) | 5.5% | 4.1% |
| Standard Deviation (Sample) | 12.3% | 8.2% |
| Standard Deviation (Population) | 12.1% | 8.1% |
Demographics Similar to Guamanians/Chamorros and Immigrants from Philippines by Seniors Poverty Over the Age of 65
In terms of seniors poverty over the age of 65, the demographic groups most similar to Guamanians/Chamorros are Immigrants from Turkey (10.5%, a difference of 0.040%), Egyptian (10.5%, a difference of 0.050%), Sierra Leonean (10.5%, a difference of 0.15%), Immigrants from Iran (10.4%, a difference of 0.20%), and Immigrants from Oceania (10.4%, a difference of 0.20%). Similarly, the demographic groups most similar to Immigrants from Philippines are Immigrants from Hungary (10.4%, a difference of 0.070%), Cambodian (10.4%, a difference of 0.070%), Asian (10.4%, a difference of 0.14%), Hmong (10.4%, a difference of 0.17%), and Ottawa (10.4%, a difference of 0.20%).
| Demographics | Rating | Rank | Seniors Poverty Over the Age of 65 |
| Immigrants | Western Europe | 91.1 /100 | #119 | Exceptional 10.4% |
| Immigrants | Bosnia and Herzegovina | 90.8 /100 | #120 | Exceptional 10.4% |
| Immigrants | Iraq | 90.7 /100 | #121 | Exceptional 10.4% |
| Immigrants | Moldova | 90.7 /100 | #122 | Exceptional 10.4% |
| Hmong | 90.0 /100 | #123 | Exceptional 10.4% |
| Asians | 89.9 /100 | #124 | Excellent 10.4% |
| Immigrants | Philippines | 89.4 /100 | #125 | Excellent 10.4% |
| Immigrants | Hungary | 89.1 /100 | #126 | Excellent 10.4% |
| Cambodians | 89.1 /100 | #127 | Excellent 10.4% |
| Ottawa | 88.5 /100 | #128 | Excellent 10.4% |
| Immigrants | Iran | 88.4 /100 | #129 | Excellent 10.4% |
| Immigrants | Oceania | 88.4 /100 | #130 | Excellent 10.4% |
| Egyptians | 87.8 /100 | #131 | Excellent 10.5% |
| Immigrants | Turkey | 87.7 /100 | #132 | Excellent 10.5% |
| Guamanians/Chamorros | 87.5 /100 | #133 | Excellent 10.5% |
| Sierra Leoneans | 86.8 /100 | #134 | Excellent 10.5% |
| Immigrants | Norway | 86.5 /100 | #135 | Excellent 10.5% |
| Immigrants | Serbia | 86.4 /100 | #136 | Excellent 10.5% |
| Immigrants | Australia | 85.1 /100 | #137 | Excellent 10.5% |
| Immigrants | Latvia | 84.7 /100 | #138 | Excellent 10.5% |
| Portuguese | 84.1 /100 | #139 | Excellent 10.5% |