Guamanian/Chamorro vs Immigrants from Philippines Unemployment Among Ages 30 to 34 years
COMPARE
Guamanian/Chamorro
Immigrants from Philippines
Unemployment Among Ages 30 to 34 years
Unemployment Among Ages 30 to 34 years Comparison
Guamanians/Chamorros
Immigrants from Philippines
5.8%
UNEMPLOYMENT AMONG AGES 30 TO 34 YEARS
3.9/ 100
METRIC RATING
221st/ 347
METRIC RANK
5.7%
UNEMPLOYMENT AMONG AGES 30 TO 34 YEARS
11.5/ 100
METRIC RATING
208th/ 347
METRIC RANK
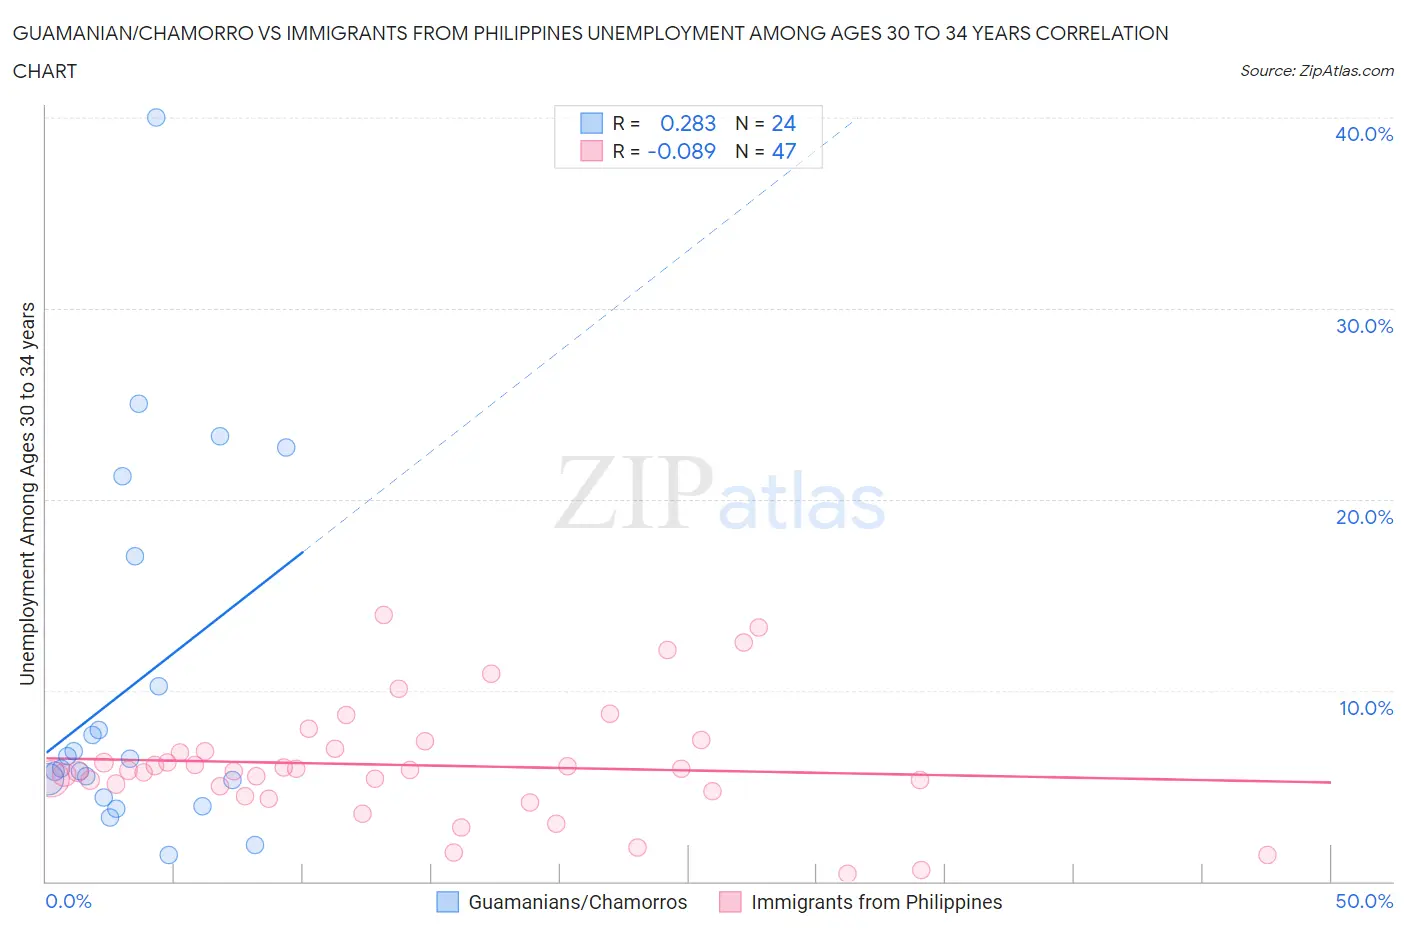
Guamanian/Chamorro vs Immigrants from Philippines Unemployment Among Ages 30 to 34 years Correlation Chart
The statistical analysis conducted on geographies consisting of 215,599,306 people shows a weak positive correlation between the proportion of Guamanians/Chamorros and unemployment rate among population between the ages 30 and 34 in the United States with a correlation coefficient (R) of 0.283 and weighted average of 5.8%. Similarly, the statistical analysis conducted on geographies consisting of 437,048,228 people shows a slight negative correlation between the proportion of Immigrants from Philippines and unemployment rate among population between the ages 30 and 34 in the United States with a correlation coefficient (R) of -0.089 and weighted average of 5.7%, a difference of 2.0%.
Unemployment Among Ages 30 to 34 years Correlation Summary
| Measurement | Guamanian/Chamorro | Immigrants from Philippines |
| Minimum | 1.4% | 0.40% |
| Maximum | 40.0% | 14.0% |
| Range | 38.6% | 13.6% |
| Mean | 10.3% | 6.1% |
| Median | 6.2% | 5.8% |
| Interquartile 25% (IQ1) | 4.8% | 4.7% |
| Interquartile 75% (IQ3) | 13.6% | 6.9% |
| Interquartile Range (IQR) | 8.8% | 2.2% |
| Standard Deviation (Sample) | 9.5% | 3.0% |
| Standard Deviation (Population) | 9.3% | 3.0% |
Demographics Similar to Guamanians/Chamorros and Immigrants from Philippines by Unemployment Among Ages 30 to 34 years
In terms of unemployment among ages 30 to 34 years, the demographic groups most similar to Guamanians/Chamorros are Sierra Leonean (5.8%, a difference of 0.020%), French Canadian (5.8%, a difference of 0.23%), Panamanian (5.8%, a difference of 0.26%), Spaniard (5.8%, a difference of 0.33%), and Immigrants from Fiji (5.7%, a difference of 0.47%). Similarly, the demographic groups most similar to Immigrants from Philippines are French (5.7%, a difference of 0.12%), Israeli (5.6%, a difference of 0.21%), Alsatian (5.6%, a difference of 0.43%), White/Caucasian (5.7%, a difference of 0.43%), and Immigrants from Costa Rica (5.6%, a difference of 0.44%).
| Demographics | Rating | Rank | Unemployment Among Ages 30 to 34 years |
| Immigrants | Cameroon | 18.4 /100 | #204 | Poor 5.6% |
| Immigrants | Costa Rica | 14.4 /100 | #205 | Poor 5.6% |
| Alsatians | 14.3 /100 | #206 | Poor 5.6% |
| Israelis | 12.8 /100 | #207 | Poor 5.6% |
| Immigrants | Philippines | 11.5 /100 | #208 | Poor 5.7% |
| French | 10.8 /100 | #209 | Poor 5.7% |
| Whites/Caucasians | 9.2 /100 | #210 | Tragic 5.7% |
| Spanish American Indians | 8.7 /100 | #211 | Tragic 5.7% |
| Scotch-Irish | 8.6 /100 | #212 | Tragic 5.7% |
| Immigrants | Immigrants | 7.1 /100 | #213 | Tragic 5.7% |
| Immigrants | Panama | 5.9 /100 | #214 | Tragic 5.7% |
| Immigrants | Cambodia | 5.8 /100 | #215 | Tragic 5.7% |
| Immigrants | Syria | 5.5 /100 | #216 | Tragic 5.7% |
| Immigrants | Fiji | 5.1 /100 | #217 | Tragic 5.7% |
| Panamanians | 4.5 /100 | #218 | Tragic 5.8% |
| French Canadians | 4.4 /100 | #219 | Tragic 5.8% |
| Sierra Leoneans | 3.9 /100 | #220 | Tragic 5.8% |
| Guamanians/Chamorros | 3.9 /100 | #221 | Tragic 5.8% |
| Spaniards | 3.2 /100 | #222 | Tragic 5.8% |
| Bermudans | 2.7 /100 | #223 | Tragic 5.8% |
| Slovaks | 2.5 /100 | #224 | Tragic 5.8% |