Black/African American vs Immigrants from Philippines No Vehicles in Household
COMPARE
Black/African American
Immigrants from Philippines
No Vehicles in Household
No Vehicles in Household Comparison
Blacks/African Americans
Immigrants from Philippines
11.9%
NO VEHICLES IN HOUSEHOLD
1.6/ 100
METRIC RATING
251st/ 347
METRIC RANK
8.5%
NO VEHICLES IN HOUSEHOLD
99.5/ 100
METRIC RATING
76th/ 347
METRIC RANK
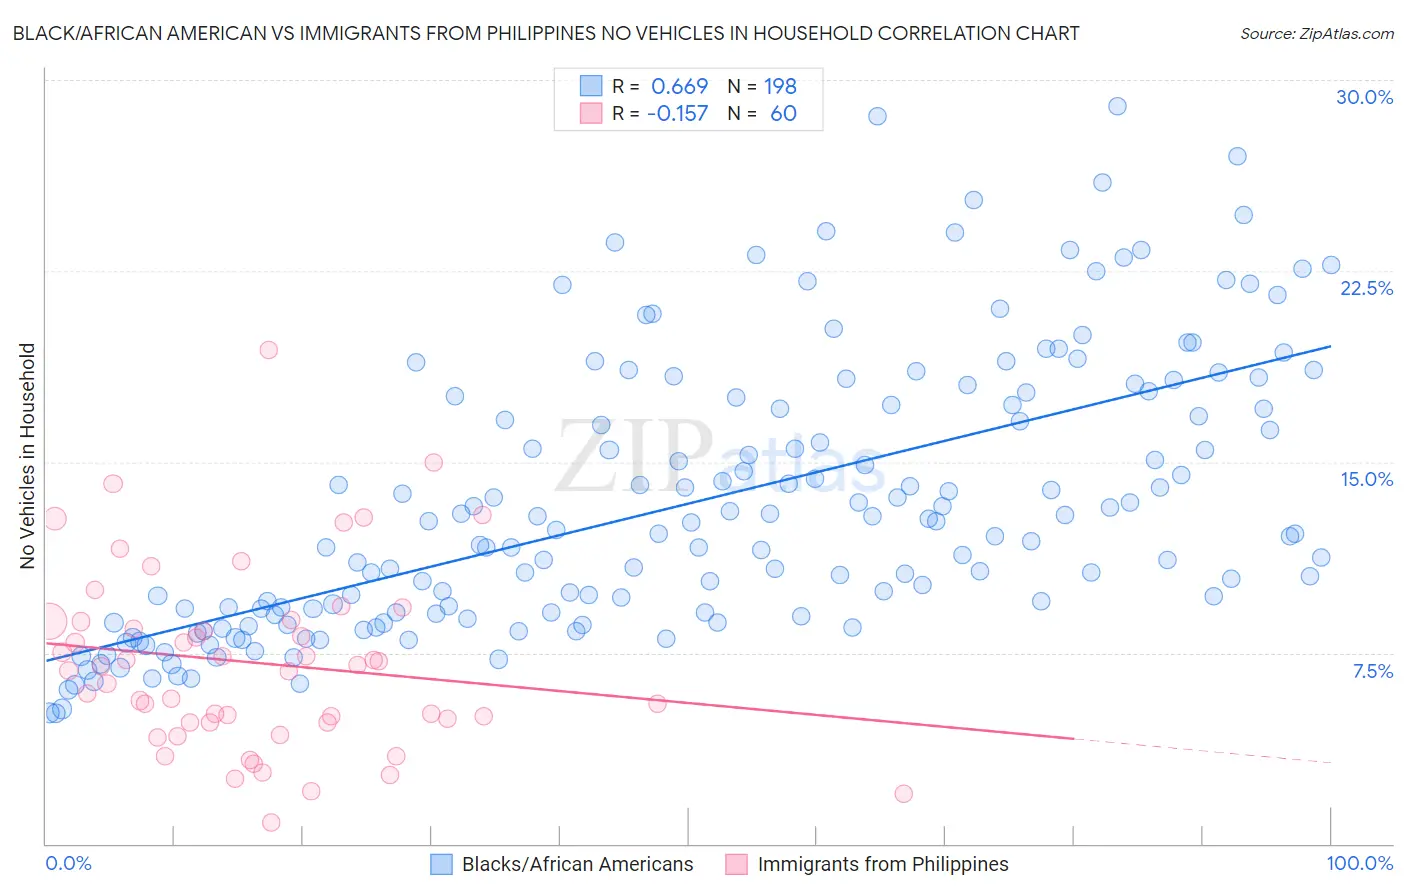
Black/African American vs Immigrants from Philippines No Vehicles in Household Correlation Chart
The statistical analysis conducted on geographies consisting of 549,724,013 people shows a significant positive correlation between the proportion of Blacks/African Americans and percentage of households with no vehicle available in the United States with a correlation coefficient (R) of 0.669 and weighted average of 11.9%. Similarly, the statistical analysis conducted on geographies consisting of 469,724,480 people shows a poor negative correlation between the proportion of Immigrants from Philippines and percentage of households with no vehicle available in the United States with a correlation coefficient (R) of -0.157 and weighted average of 8.5%, a difference of 38.7%.
No Vehicles in Household Correlation Summary
| Measurement | Black/African American | Immigrants from Philippines |
| Minimum | 5.1% | 0.84% |
| Maximum | 29.0% | 19.4% |
| Range | 23.8% | 18.6% |
| Mean | 13.4% | 7.1% |
| Median | 12.2% | 6.9% |
| Interquartile 25% (IQ1) | 9.1% | 4.8% |
| Interquartile 75% (IQ3) | 17.3% | 8.7% |
| Interquartile Range (IQR) | 8.2% | 4.0% |
| Standard Deviation (Sample) | 5.4% | 3.6% |
| Standard Deviation (Population) | 5.3% | 3.6% |
Similar Demographics by No Vehicles in Household
Demographics Similar to Blacks/African Americans by No Vehicles in Household
In terms of no vehicles in household, the demographic groups most similar to Blacks/African Americans are Immigrants from Serbia (11.9%, a difference of 0.25%), Egyptian (11.9%, a difference of 0.32%), Paiute (11.8%, a difference of 0.35%), Immigrants from Nigeria (11.8%, a difference of 0.57%), and Immigrants from Belgium (11.8%, a difference of 0.60%).
| Demographics | Rating | Rank | No Vehicles in Household |
| Immigrants | Portugal | 2.2 /100 | #244 | Tragic 11.7% |
| Immigrants | Honduras | 2.1 /100 | #245 | Tragic 11.8% |
| Menominee | 2.0 /100 | #246 | Tragic 11.8% |
| Immigrants | Czechoslovakia | 2.0 /100 | #247 | Tragic 11.8% |
| Immigrants | Belgium | 1.9 /100 | #248 | Tragic 11.8% |
| Immigrants | Nigeria | 1.9 /100 | #249 | Tragic 11.8% |
| Paiute | 1.8 /100 | #250 | Tragic 11.8% |
| Blacks/African Americans | 1.6 /100 | #251 | Tragic 11.9% |
| Immigrants | Serbia | 1.5 /100 | #252 | Tragic 11.9% |
| Egyptians | 1.4 /100 | #253 | Tragic 11.9% |
| Immigrants | Uruguay | 1.3 /100 | #254 | Tragic 11.9% |
| Hondurans | 1.2 /100 | #255 | Tragic 12.0% |
| Liberians | 1.2 /100 | #256 | Tragic 12.0% |
| Nigerians | 0.9 /100 | #257 | Tragic 12.1% |
| South American Indians | 0.9 /100 | #258 | Tragic 12.1% |
Demographics Similar to Immigrants from Philippines by No Vehicles in Household
In terms of no vehicles in household, the demographic groups most similar to Immigrants from Philippines are Iranian (8.6%, a difference of 0.090%), Immigrants from South Central Asia (8.6%, a difference of 0.21%), Jordanian (8.5%, a difference of 0.24%), Portuguese (8.6%, a difference of 0.26%), and Bolivian (8.6%, a difference of 0.41%).
| Demographics | Rating | Rank | No Vehicles in Household |
| Spaniards | 99.7 /100 | #69 | Exceptional 8.4% |
| Cajuns | 99.6 /100 | #70 | Exceptional 8.4% |
| Immigrants | Lebanon | 99.6 /100 | #71 | Exceptional 8.4% |
| Lithuanians | 99.6 /100 | #72 | Exceptional 8.4% |
| Poles | 99.6 /100 | #73 | Exceptional 8.4% |
| Cubans | 99.5 /100 | #74 | Exceptional 8.5% |
| Jordanians | 99.5 /100 | #75 | Exceptional 8.5% |
| Immigrants | Philippines | 99.5 /100 | #76 | Exceptional 8.5% |
| Iranians | 99.5 /100 | #77 | Exceptional 8.6% |
| Immigrants | South Central Asia | 99.5 /100 | #78 | Exceptional 8.6% |
| Portuguese | 99.5 /100 | #79 | Exceptional 8.6% |
| Bolivians | 99.4 /100 | #80 | Exceptional 8.6% |
| Tsimshian | 99.4 /100 | #81 | Exceptional 8.6% |
| Immigrants | South Eastern Asia | 99.4 /100 | #82 | Exceptional 8.6% |
| Italians | 99.4 /100 | #83 | Exceptional 8.6% |