Ottawa vs Immigrants from Jordan No Vehicles in Household
COMPARE
Ottawa
Immigrants from Jordan
No Vehicles in Household
No Vehicles in Household Comparison
Ottawa
Immigrants from Jordan
7.4%
NO VEHICLES IN HOUSEHOLD
100.0/ 100
METRIC RATING
20th/ 347
METRIC RANK
8.7%
NO VEHICLES IN HOUSEHOLD
99.3/ 100
METRIC RATING
84th/ 347
METRIC RANK
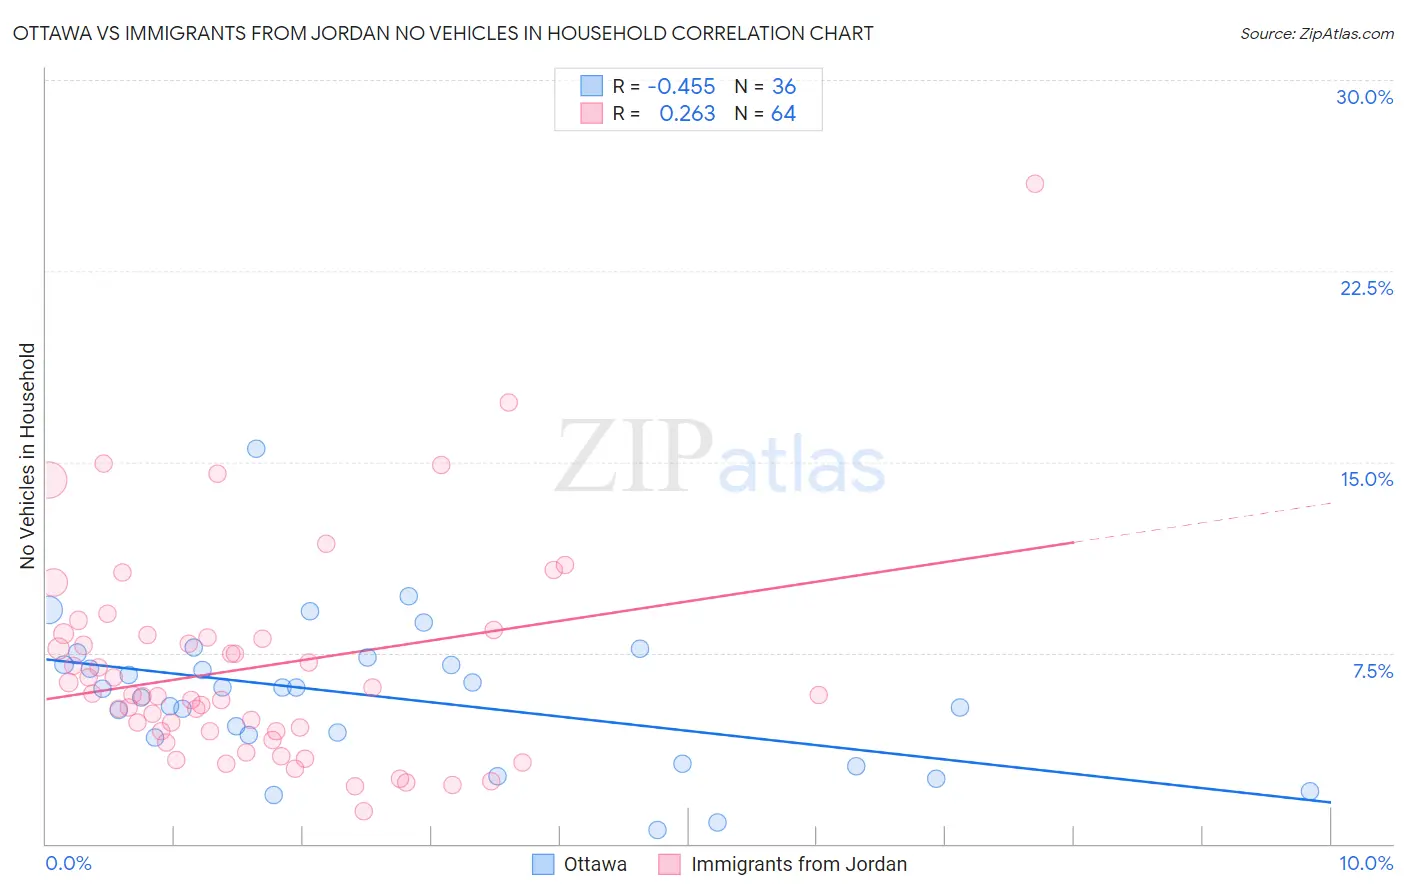
Ottawa vs Immigrants from Jordan No Vehicles in Household Correlation Chart
The statistical analysis conducted on geographies consisting of 49,929,358 people shows a moderate negative correlation between the proportion of Ottawa and percentage of households with no vehicle available in the United States with a correlation coefficient (R) of -0.455 and weighted average of 7.4%. Similarly, the statistical analysis conducted on geographies consisting of 181,152,945 people shows a weak positive correlation between the proportion of Immigrants from Jordan and percentage of households with no vehicle available in the United States with a correlation coefficient (R) of 0.263 and weighted average of 8.7%, a difference of 17.2%.
No Vehicles in Household Correlation Summary
| Measurement | Ottawa | Immigrants from Jordan |
| Minimum | 0.55% | 1.3% |
| Maximum | 15.5% | 25.9% |
| Range | 15.0% | 24.6% |
| Mean | 5.8% | 6.9% |
| Median | 6.1% | 5.9% |
| Interquartile 25% (IQ1) | 4.2% | 4.4% |
| Interquartile 75% (IQ3) | 7.2% | 8.1% |
| Interquartile Range (IQR) | 3.0% | 3.7% |
| Standard Deviation (Sample) | 2.9% | 4.2% |
| Standard Deviation (Population) | 2.8% | 4.2% |
Similar Demographics by No Vehicles in Household
Demographics Similar to Ottawa by No Vehicles in Household
In terms of no vehicles in household, the demographic groups most similar to Ottawa are Nepalese (7.4%, a difference of 0.15%), Arapaho (7.4%, a difference of 0.42%), Irish (7.4%, a difference of 0.75%), French (7.4%, a difference of 0.80%), and Immigrants from Iraq (7.5%, a difference of 1.2%).
| Demographics | Rating | Rank | No Vehicles in Household |
| Scandinavians | 100.0 /100 | #13 | Exceptional 7.0% |
| Mexicans | 100.0 /100 | #14 | Exceptional 7.0% |
| Whites/Caucasians | 100.0 /100 | #15 | Exceptional 7.0% |
| Europeans | 100.0 /100 | #16 | Exceptional 7.1% |
| Welsh | 100.0 /100 | #17 | Exceptional 7.2% |
| Tongans | 100.0 /100 | #18 | Exceptional 7.2% |
| Arapaho | 100.0 /100 | #19 | Exceptional 7.4% |
| Ottawa | 100.0 /100 | #20 | Exceptional 7.4% |
| Nepalese | 100.0 /100 | #21 | Exceptional 7.4% |
| Irish | 100.0 /100 | #22 | Exceptional 7.4% |
| French | 100.0 /100 | #23 | Exceptional 7.4% |
| Immigrants | Iraq | 100.0 /100 | #24 | Exceptional 7.5% |
| Yaqui | 100.0 /100 | #25 | Exceptional 7.5% |
| Sri Lankans | 100.0 /100 | #26 | Exceptional 7.6% |
| British | 100.0 /100 | #27 | Exceptional 7.6% |
Demographics Similar to Immigrants from Jordan by No Vehicles in Household
In terms of no vehicles in household, the demographic groups most similar to Immigrants from Jordan are Lebanese (8.7%, a difference of 0.060%), Bangladeshi (8.7%, a difference of 0.16%), Italian (8.6%, a difference of 0.25%), Immigrants from England (8.7%, a difference of 0.39%), and Osage (8.7%, a difference of 0.51%).
| Demographics | Rating | Rank | No Vehicles in Household |
| Iranians | 99.5 /100 | #77 | Exceptional 8.6% |
| Immigrants | South Central Asia | 99.5 /100 | #78 | Exceptional 8.6% |
| Portuguese | 99.5 /100 | #79 | Exceptional 8.6% |
| Bolivians | 99.4 /100 | #80 | Exceptional 8.6% |
| Tsimshian | 99.4 /100 | #81 | Exceptional 8.6% |
| Immigrants | South Eastern Asia | 99.4 /100 | #82 | Exceptional 8.6% |
| Italians | 99.4 /100 | #83 | Exceptional 8.6% |
| Immigrants | Jordan | 99.3 /100 | #84 | Exceptional 8.7% |
| Lebanese | 99.3 /100 | #85 | Exceptional 8.7% |
| Bangladeshis | 99.3 /100 | #86 | Exceptional 8.7% |
| Immigrants | England | 99.2 /100 | #87 | Exceptional 8.7% |
| Osage | 99.2 /100 | #88 | Exceptional 8.7% |
| Immigrants | Cuba | 99.2 /100 | #89 | Exceptional 8.7% |
| Bhutanese | 99.2 /100 | #90 | Exceptional 8.7% |
| Immigrants | Germany | 99.1 /100 | #91 | Exceptional 8.7% |