Cuban vs Immigrants from Jordan No Vehicles in Household
COMPARE
Cuban
Immigrants from Jordan
No Vehicles in Household
No Vehicles in Household Comparison
Cubans
Immigrants from Jordan
8.5%
NO VEHICLES IN HOUSEHOLD
99.5/ 100
METRIC RATING
74th/ 347
METRIC RANK
8.7%
NO VEHICLES IN HOUSEHOLD
99.3/ 100
METRIC RATING
84th/ 347
METRIC RANK
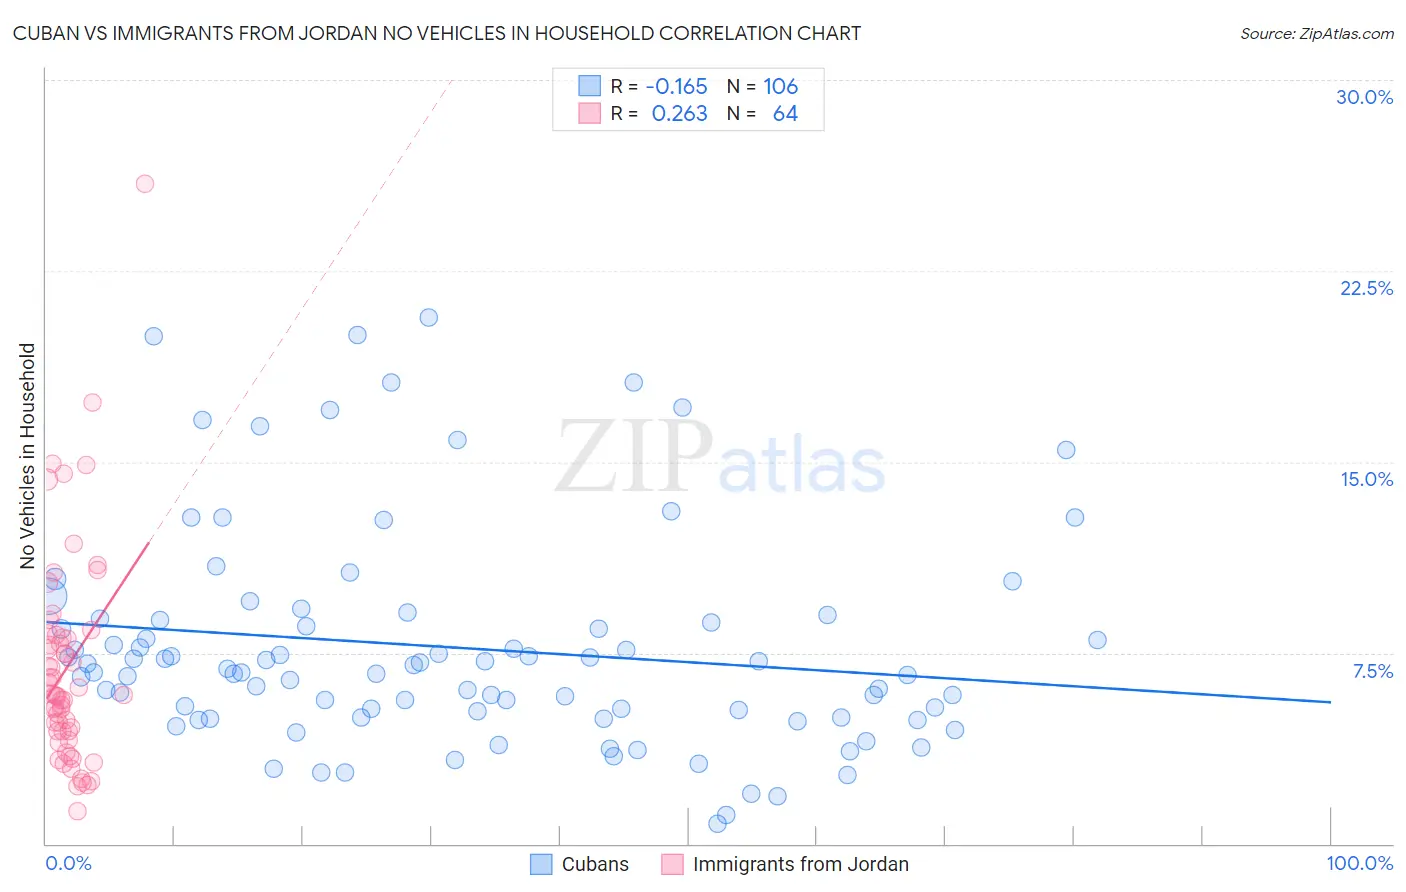
Cuban vs Immigrants from Jordan No Vehicles in Household Correlation Chart
The statistical analysis conducted on geographies consisting of 447,809,570 people shows a poor negative correlation between the proportion of Cubans and percentage of households with no vehicle available in the United States with a correlation coefficient (R) of -0.165 and weighted average of 8.5%. Similarly, the statistical analysis conducted on geographies consisting of 181,152,945 people shows a weak positive correlation between the proportion of Immigrants from Jordan and percentage of households with no vehicle available in the United States with a correlation coefficient (R) of 0.263 and weighted average of 8.7%, a difference of 1.7%.
No Vehicles in Household Correlation Summary
| Measurement | Cuban | Immigrants from Jordan |
| Minimum | 0.80% | 1.3% |
| Maximum | 20.7% | 25.9% |
| Range | 19.9% | 24.6% |
| Mean | 7.7% | 6.9% |
| Median | 6.8% | 5.9% |
| Interquartile 25% (IQ1) | 5.0% | 4.4% |
| Interquartile 75% (IQ3) | 8.8% | 8.1% |
| Interquartile Range (IQR) | 3.8% | 3.7% |
| Standard Deviation (Sample) | 4.3% | 4.2% |
| Standard Deviation (Population) | 4.2% | 4.2% |
Demographics Similar to Cubans and Immigrants from Jordan by No Vehicles in Household
In terms of no vehicles in household, the demographic groups most similar to Cubans are Jordanian (8.5%, a difference of 0.22%), Immigrants from Philippines (8.5%, a difference of 0.46%), Iranian (8.6%, a difference of 0.55%), Immigrants from South Central Asia (8.6%, a difference of 0.67%), and Portuguese (8.6%, a difference of 0.73%). Similarly, the demographic groups most similar to Immigrants from Jordan are Lebanese (8.7%, a difference of 0.060%), Bangladeshi (8.7%, a difference of 0.16%), Italian (8.6%, a difference of 0.25%), Immigrants from England (8.7%, a difference of 0.39%), and Osage (8.7%, a difference of 0.51%).
| Demographics | Rating | Rank | No Vehicles in Household |
| Spaniards | 99.7 /100 | #69 | Exceptional 8.4% |
| Cajuns | 99.6 /100 | #70 | Exceptional 8.4% |
| Immigrants | Lebanon | 99.6 /100 | #71 | Exceptional 8.4% |
| Lithuanians | 99.6 /100 | #72 | Exceptional 8.4% |
| Poles | 99.6 /100 | #73 | Exceptional 8.4% |
| Cubans | 99.5 /100 | #74 | Exceptional 8.5% |
| Jordanians | 99.5 /100 | #75 | Exceptional 8.5% |
| Immigrants | Philippines | 99.5 /100 | #76 | Exceptional 8.5% |
| Iranians | 99.5 /100 | #77 | Exceptional 8.6% |
| Immigrants | South Central Asia | 99.5 /100 | #78 | Exceptional 8.6% |
| Portuguese | 99.5 /100 | #79 | Exceptional 8.6% |
| Bolivians | 99.4 /100 | #80 | Exceptional 8.6% |
| Tsimshian | 99.4 /100 | #81 | Exceptional 8.6% |
| Immigrants | South Eastern Asia | 99.4 /100 | #82 | Exceptional 8.6% |
| Italians | 99.4 /100 | #83 | Exceptional 8.6% |
| Immigrants | Jordan | 99.3 /100 | #84 | Exceptional 8.7% |
| Lebanese | 99.3 /100 | #85 | Exceptional 8.7% |
| Bangladeshis | 99.3 /100 | #86 | Exceptional 8.7% |
| Immigrants | England | 99.2 /100 | #87 | Exceptional 8.7% |
| Osage | 99.2 /100 | #88 | Exceptional 8.7% |
| Immigrants | Cuba | 99.2 /100 | #89 | Exceptional 8.7% |