Guamanian/Chamorro vs Immigrants from Jordan Child Poverty Under the Age of 16
COMPARE
Guamanian/Chamorro
Immigrants from Jordan
Child Poverty Under the Age of 16
Child Poverty Under the Age of 16 Comparison
Guamanians/Chamorros
Immigrants from Jordan
15.9%
CHILD POVERTY UNDER THE AGE OF 16
66.4/ 100
METRIC RATING
165th/ 347
METRIC RANK
15.6%
CHILD POVERTY UNDER THE AGE OF 16
78.5/ 100
METRIC RATING
150th/ 347
METRIC RANK
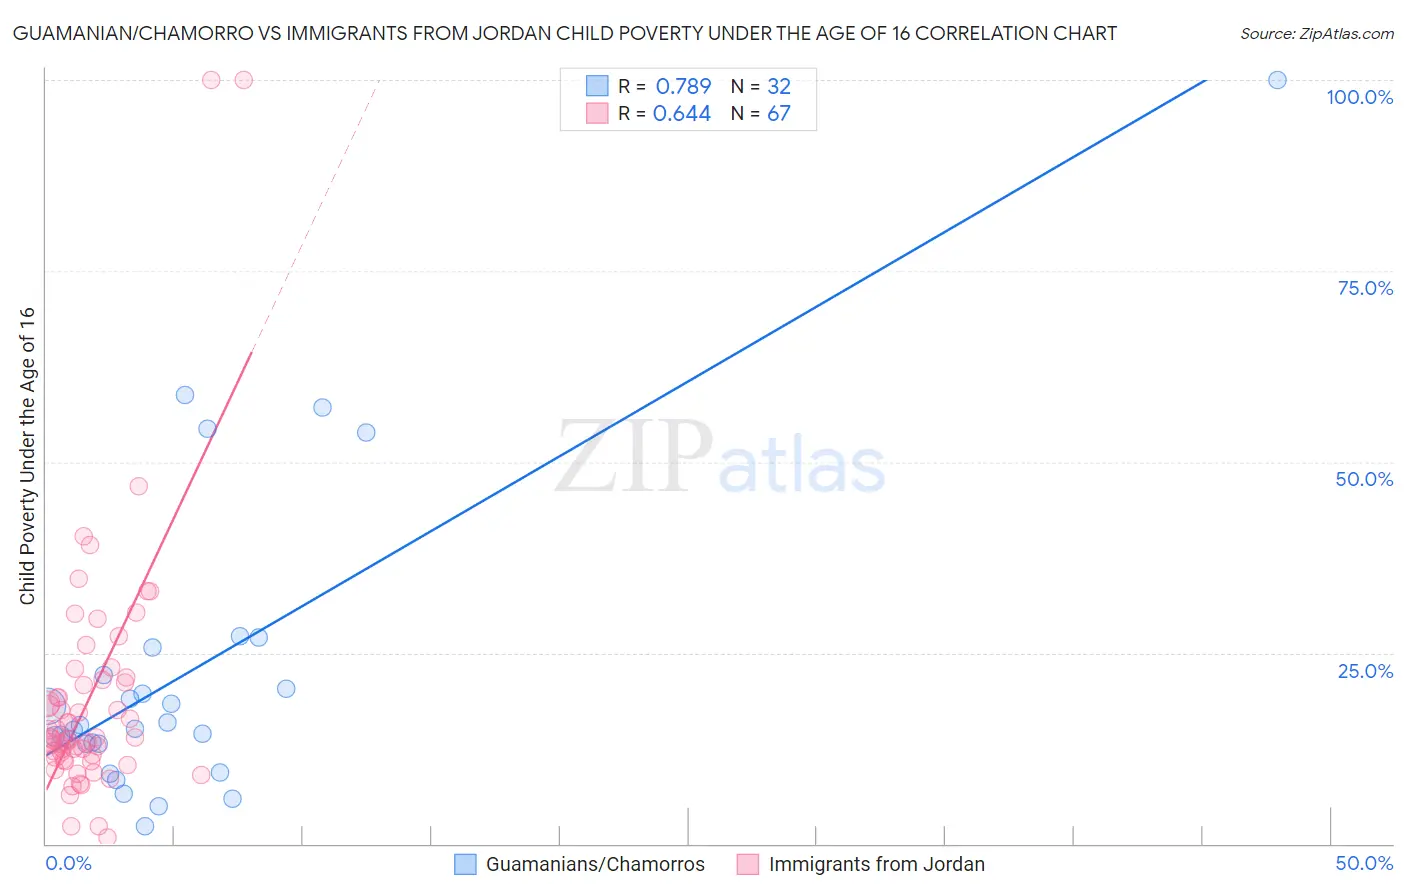
Guamanian/Chamorro vs Immigrants from Jordan Child Poverty Under the Age of 16 Correlation Chart
The statistical analysis conducted on geographies consisting of 221,179,374 people shows a strong positive correlation between the proportion of Guamanians/Chamorros and poverty level among children under the age of 16 in the United States with a correlation coefficient (R) of 0.789 and weighted average of 15.9%. Similarly, the statistical analysis conducted on geographies consisting of 180,809,646 people shows a significant positive correlation between the proportion of Immigrants from Jordan and poverty level among children under the age of 16 in the United States with a correlation coefficient (R) of 0.644 and weighted average of 15.6%, a difference of 1.9%.
Child Poverty Under the Age of 16 Correlation Summary
| Measurement | Guamanian/Chamorro | Immigrants from Jordan |
| Minimum | 2.2% | 0.79% |
| Maximum | 100.0% | 100.0% |
| Range | 97.8% | 99.2% |
| Mean | 22.7% | 19.2% |
| Median | 15.3% | 13.8% |
| Interquartile 25% (IQ1) | 13.1% | 11.3% |
| Interquartile 75% (IQ3) | 23.9% | 21.5% |
| Interquartile Range (IQR) | 10.7% | 10.2% |
| Standard Deviation (Sample) | 20.6% | 16.9% |
| Standard Deviation (Population) | 20.3% | 16.8% |
Demographics Similar to Guamanians/Chamorros and Immigrants from Jordan by Child Poverty Under the Age of 16
In terms of child poverty under the age of 16, the demographic groups most similar to Guamanians/Chamorros are Immigrants from Germany (15.8%, a difference of 0.13%), Immigrants from Oceania (15.9%, a difference of 0.13%), Colombian (15.8%, a difference of 0.17%), Yugoslavian (15.8%, a difference of 0.17%), and Immigrants from Northern Africa (15.8%, a difference of 0.23%). Similarly, the demographic groups most similar to Immigrants from Jordan are French (15.6%, a difference of 0.0%), French Canadian (15.6%, a difference of 0.040%), Venezuelan (15.6%, a difference of 0.19%), Samoan (15.6%, a difference of 0.22%), and Israeli (15.5%, a difference of 0.32%).
| Demographics | Rating | Rank | Child Poverty Under the Age of 16 |
| Immigrants | Kuwait | 80.5 /100 | #147 | Excellent 15.5% |
| Puget Sound Salish | 80.3 /100 | #148 | Excellent 15.5% |
| Israelis | 80.1 /100 | #149 | Excellent 15.5% |
| Immigrants | Jordan | 78.5 /100 | #150 | Good 15.6% |
| French | 78.5 /100 | #151 | Good 15.6% |
| French Canadians | 78.2 /100 | #152 | Good 15.6% |
| Venezuelans | 77.4 /100 | #153 | Good 15.6% |
| Samoans | 77.3 /100 | #154 | Good 15.6% |
| Syrians | 76.1 /100 | #155 | Good 15.6% |
| Immigrants | Venezuela | 74.9 /100 | #156 | Good 15.7% |
| Immigrants | Nepal | 72.9 /100 | #157 | Good 15.7% |
| Immigrants | Chile | 72.8 /100 | #158 | Good 15.7% |
| Immigrants | Fiji | 71.1 /100 | #159 | Good 15.8% |
| Immigrants | Albania | 70.7 /100 | #160 | Good 15.8% |
| Immigrants | Northern Africa | 68.1 /100 | #161 | Good 15.8% |
| Colombians | 67.6 /100 | #162 | Good 15.8% |
| Yugoslavians | 67.6 /100 | #163 | Good 15.8% |
| Immigrants | Germany | 67.3 /100 | #164 | Good 15.8% |
| Guamanians/Chamorros | 66.4 /100 | #165 | Good 15.9% |
| Immigrants | Oceania | 65.4 /100 | #166 | Good 15.9% |
| Costa Ricans | 61.1 /100 | #167 | Good 16.0% |