Canadian vs Kiowa Median Household Income

COMPARE

Canadian
Race
Ancestry
AfghanAfricanAlaska NativeAlaskan AthabascanAlbanianAleutAlsatianAmericanApacheArabArapahoArgentineanArmenianAssyrian/Chaldean/SyriacAustralianAustrianBahamianBangladeshiBarbadianBasqueBelgianBelizeanBermudanBhutaneseBlackfeetBolivianBrazilianBritishBritish West IndianBulgarianBurmeseCajunCambodianCanadianCape VerdeanCarpatho RusynCelticCentral AmericanCentral American IndianCherokeeCheyenneChickasawChileanChineseChippewaChoctawColombianColvilleComancheCosta RicanCreeCreekCroatianCrowCubanCypriotCzechCzechoslovakianDanishDelawareDominicanDutchDutch West IndianEastern EuropeanEcuadorianEgyptianEnglishEstonianEthiopianEuropeanFijianFilipinoFinnishFrenchFrench American IndianFrench CanadianGermanGerman RussianGhanaianGreekGuamanian/ChamorroGuatemalanGuyaneseHaitianHmongHonduranHopiHoumaHungarianIcelanderIndian (Asian)IndonesianInupiatIranianIraqiIrishIroquoisIsraeliItalianJamaicanJapaneseJordanianKenyanKoreanLaotianLatvianLebaneseLiberianLithuanianLumbeeLuxembourgerMacedonianMalaysianMalteseMarshalleseMenomineeMexicanMexican American IndianMongolianMoroccanNative HawaiianNavajoNepaleseNew ZealanderNicaraguanNigerianNorthern EuropeanNorwegianOkinawanOsageOttawaPaiutePakistaniPalestinianPanamanianParaguayanPennsylvania GermanPeruvianPimaPolishPortuguesePotawatomiPuebloPuerto RicanPuget Sound SalishRomanianRussianSalvadoranSamoanScandinavianScotch-IrishScottishSeminoleSenegaleseSerbianShoshoneSierra LeoneanSiouxSlavicSlovakSloveneSomaliSouth AfricanSouth AmericanSouth American IndianSoviet UnionSpaniardSpanishSpanish AmericanSpanish American IndianSri LankanSubsaharan AfricanSudaneseSwedishSwissSyrianTaiwaneseThaiTlingit-HaidaTohono O'OdhamTonganTrinidadian and TobagonianTsimshianTurkishU.S. Virgin IslanderUgandanUkrainianUruguayanUteVenezuelanVietnameseWelshWest IndianYakamaYaquiYugoslavianYumanYup'ikZimbabwean
Immigration
NonimmigrantsImmigrantsAfghanistanAfricaAlbaniaArgentinaArmeniaAsiaAustraliaAustriaBahamasBangladeshBarbadosBelarusBelgiumBelizeBoliviaBosnia and HerzegovinaBrazilBulgariaBurma/MyanmarCabo VerdeCambodiaCameroonCanadaCaribbeanCentral AmericaChileChinaColombiaCongoCosta RicaCroatiaCubaCzechoslovakiaDenmarkDominicaDominican RepublicEastern AfricaEastern AsiaEastern EuropeEcuadorEgyptEl SalvadorEnglandEritreaEthiopiaEuropeFijiFranceGermanyGhanaGreeceGrenadaGuatemalaGuyanaHaitiHondurasHong KongHungaryIndiaIndonesiaIranIraqIrelandIsraelItalyJamaicaJapanJordanKazakhstanKenyaKoreaKuwaitLaosLatin AmericaLatviaLebanonLiberiaLithuaniaMalaysiaMexicoMicronesiaMiddle AfricaMoldovaMoroccoNepalNetherlandsNicaraguaNigeriaNorth AmericaNorth MacedoniaNorthern AfricaNorthern EuropeNorwayOceaniaPakistanPanamaPeruPhilippinesPolandPortugalRomaniaRussiaSaudi ArabiaScotlandSenegalSerbiaSierra LeoneSingaporeSomaliaSouth AfricaSouth AmericaSouth Central AsiaSouth Eastern AsiaSouthern EuropeSpainSri LankaSt. Vincent and the GrenadinesSudanSwedenSwitzerlandSyriaTaiwanThailandTrinidad and TobagoTurkeyUgandaUkraineUruguayUzbekistanVenezuelaVietnamWest IndiesWestern AfricaWestern AsiaWestern EuropeYemenZaireZimbabweAzores
Kiowa
Race
Ancestry
AfghanAfricanAlaska NativeAlaskan AthabascanAlbanianAleutAlsatianAmericanApacheArabArapahoArgentineanArmenianAssyrian/Chaldean/SyriacAustralianAustrianBahamianBangladeshiBarbadianBasqueBelgianBelizeanBermudanBhutaneseBlackfeetBolivianBrazilianBritishBritish West IndianBulgarianBurmeseCajunCambodianCape VerdeanCarpatho RusynCelticCentral AmericanCentral American IndianCherokeeCheyenneChickasawChileanChineseChippewaChoctawColombianColvilleComancheCosta RicanCreeCreekCroatianCrowCubanCypriotCzechCzechoslovakianDanishDelawareDominicanDutchDutch West IndianEastern EuropeanEcuadorianEgyptianEnglishEstonianEthiopianEuropeanFijianFilipinoFinnishFrenchFrench American IndianFrench CanadianGermanGerman RussianGhanaianGreekGuamanian/ChamorroGuatemalanGuyaneseHaitianHmongHonduranHopiHoumaHungarianIcelanderIndian (Asian)IndonesianInupiatIranianIraqiIrishIroquoisIsraeliItalianJamaicanJapaneseJordanianKenyanKiowaKoreanLaotianLatvianLebaneseLiberianLithuanianLumbeeLuxembourgerMacedonianMalaysianMalteseMarshalleseMenomineeMexicanMexican American IndianMongolianMoroccanNative HawaiianNavajoNepaleseNew ZealanderNicaraguanNigerianNorthern EuropeanNorwegianOkinawanOsageOttawaPaiutePakistaniPalestinianPanamanianParaguayanPennsylvania GermanPeruvianPimaPolishPortuguesePotawatomiPuebloPuerto RicanPuget Sound SalishRomanianRussianSalvadoranSamoanScandinavianScotch-IrishScottishSeminoleSenegaleseSerbianShoshoneSierra LeoneanSiouxSlavicSlovakSloveneSomaliSouth AfricanSouth AmericanSouth American IndianSoviet UnionSpaniardSpanishSpanish AmericanSpanish American IndianSri LankanSubsaharan AfricanSudaneseSwedishSwissSyrianTaiwaneseThaiTlingit-HaidaTohono O'OdhamTonganTrinidadian and TobagonianTsimshianTurkishU.S. Virgin IslanderUgandanUkrainianUruguayanUteVenezuelanVietnameseWelshWest IndianYakamaYaquiYugoslavianYumanYup'ikZimbabwean
Immigration
NonimmigrantsImmigrantsAfghanistanAfricaAlbaniaArgentinaArmeniaAsiaAustraliaAustriaBahamasBangladeshBarbadosBelarusBelgiumBelizeBoliviaBosnia and HerzegovinaBrazilBulgariaBurma/MyanmarCabo VerdeCambodiaCameroonCanadaCaribbeanCentral AmericaChileChinaColombiaCongoCosta RicaCroatiaCubaCzechoslovakiaDenmarkDominicaDominican RepublicEastern AfricaEastern AsiaEastern EuropeEcuadorEgyptEl SalvadorEnglandEritreaEthiopiaEuropeFijiFranceGermanyGhanaGreeceGrenadaGuatemalaGuyanaHaitiHondurasHong KongHungaryIndiaIndonesiaIranIraqIrelandIsraelItalyJamaicaJapanJordanKazakhstanKenyaKoreaKuwaitLaosLatin AmericaLatviaLebanonLiberiaLithuaniaMalaysiaMexicoMicronesiaMiddle AfricaMoldovaMoroccoNepalNetherlandsNicaraguaNigeriaNorth AmericaNorth MacedoniaNorthern AfricaNorthern EuropeNorwayOceaniaPakistanPanamaPeruPhilippinesPolandPortugalRomaniaRussiaSaudi ArabiaScotlandSenegalSerbiaSierra LeoneSingaporeSomaliaSouth AfricaSouth AmericaSouth Central AsiaSouth Eastern AsiaSouthern EuropeSpainSri LankaSt. Vincent and the GrenadinesSudanSwedenSwitzerlandSyriaTaiwanThailandTrinidad and TobagoTurkeyUgandaUkraineUruguayUzbekistanVenezuelaVietnamWest IndiesWestern AfricaWestern AsiaWestern EuropeYemenZaireZimbabweAzores
Median Household Income
Income
Poverty
Unemployment
Labor Participation
Family Structure
Vehicle Availability
Education Level
Disability

Median Household Income Comparison

Canadians

Kiowa

Excellent
Tragic
$87,769
MEDIAN HOUSEHOLD INCOME
84.7/ 100
METRIC RATING
142nd/ 347
METRIC RANK
$65,914
MEDIAN HOUSEHOLD INCOME
0.0/ 100
METRIC RATING
337th/ 347
METRIC RANK

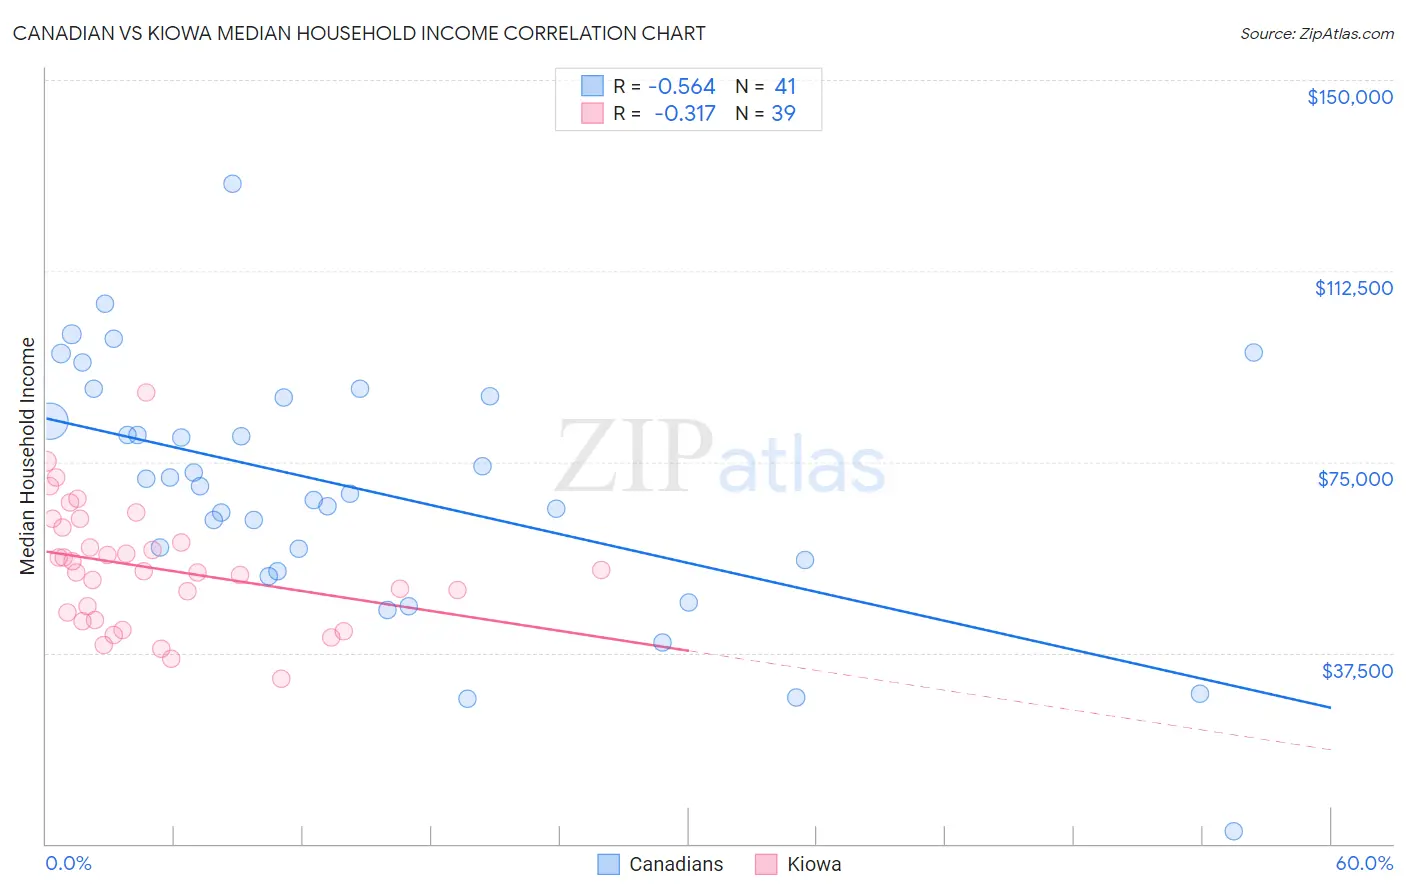
Canadian vs Kiowa Median Household Income Correlation Chart

The statistical analysis conducted on geographies consisting of 437,190,973 people shows a substantial negative correlation between the proportion of Canadians and median household income in the United States with a correlation coefficient (R) of -0.564 and weighted average of $87,769. Similarly, the statistical analysis conducted on geographies consisting of 56,098,760 people shows a mild negative correlation between the proportion of Kiowa and median household income in the United States with a correlation coefficient (R) of -0.317 and weighted average of $65,914, a difference of 33.2%.
Canadian vs Kiowa Median Household Income

Median Household Income Correlation Summary

MeasurementCanadianKiowa
Minimum$2,499$32,500
Maximum$129,644$88,558
Range$127,145$56,058
Mean$69,441$54,131
Median$70,262$53,438
Interquartile 25% (IQ1)$54,608$43,977
Interquartile 75% (IQ3)$87,722$62,181
Interquartile Range (IQR)$33,114$18,204
Standard Deviation (Sample)$24,486$11,836
Standard Deviation (Population)$24,185$11,684

Similar Demographics by Median Household Income

Demographics Similar to Canadians by Median Household Income

In terms of median household income, the demographic groups most similar to Canadians are Danish ($87,676, a difference of 0.11%), Immigrants from Morocco ($87,930, a difference of 0.18%), Serbian ($87,572, a difference of 0.22%), Ugandan ($87,557, a difference of 0.24%), and Immigrants from Uganda ($87,553, a difference of 0.25%).
DemographicsRating | RankMedian Household Income
Immigrants | Sierra Leone
89.9
/100
|
#135
Excellent
$88,498
Poles
89.7
/100
|
#136
Excellent
$88,472
Sierra Leoneans
89.6
/100
|
#137
Excellent
$88,463
Arabs
89.2
/100
|
#138
Excellent
$88,398
Immigrants | Chile
89.2
/100
|
#139
Excellent
$88,388
Lebanese
87.2
/100
|
#140
Excellent
$88,091
Immigrants | Morocco
86.0
/100
|
#141
Excellent
$87,930
Canadians
84.7
/100
|
#142
Excellent
$87,769
Danes
83.9
/100
|
#143
Excellent
$87,676
Serbians
83.0
/100
|
#144
Excellent
$87,572
Ugandans
82.9
/100
|
#145
Excellent
$87,557
Immigrants | Uganda
82.8
/100
|
#146
Excellent
$87,553
South American Indians
81.8
/100
|
#147
Excellent
$87,446
Costa Ricans
80.0
/100
|
#148
Excellent
$87,262
Immigrants | Nepal
77.7
/100
|
#149
Good
$87,046

Demographics Similar to Kiowa by Median Household Income

In terms of median household income, the demographic groups most similar to Kiowa are Immigrants from Yemen ($65,194, a difference of 1.1%), Immigrants from Congo ($66,768, a difference of 1.3%), Hopi ($65,043, a difference of 1.3%), Cheyenne ($66,974, a difference of 1.6%), and Pueblo ($64,692, a difference of 1.9%).
DemographicsRating | RankMedian Household Income
Arapaho
0.0
/100
|
#330
Tragic
$67,965
Natives/Alaskans
0.0
/100
|
#331
Tragic
$67,879
Sioux
0.0
/100
|
#332
Tragic
$67,792
Creek
0.0
/100
|
#333
Tragic
$67,715
Blacks/African Americans
0.0
/100
|
#334
Tragic
$67,573
Cheyenne
0.0
/100
|
#335
Tragic
$66,974
Immigrants | Congo
0.0
/100
|
#336
Tragic
$66,768
Kiowa
0.0
/100
|
#337
Tragic
$65,914
Immigrants | Yemen
0.0
/100
|
#338
Tragic
$65,194
Hopi
0.0
/100
|
#339
Tragic
$65,043
Pueblo
0.0
/100
|
#340
Tragic
$64,692
Crow
0.0
/100
|
#341
Tragic
$63,681
Pima
0.0
/100
|
#342
Tragic
$63,262
Houma
0.0
/100
|
#343
Tragic
$62,575
Tohono O'odham
0.0
/100
|
#344
Tragic
$61,663