Black/African American vs Immigrants from Morocco No Vehicles in Household
COMPARE
Black/African American
Immigrants from Morocco
No Vehicles in Household
No Vehicles in Household Comparison
Blacks/African Americans
Immigrants from Morocco
11.9%
NO VEHICLES IN HOUSEHOLD
1.6/ 100
METRIC RATING
251st/ 347
METRIC RANK
12.6%
NO VEHICLES IN HOUSEHOLD
0.2/ 100
METRIC RATING
271st/ 347
METRIC RANK
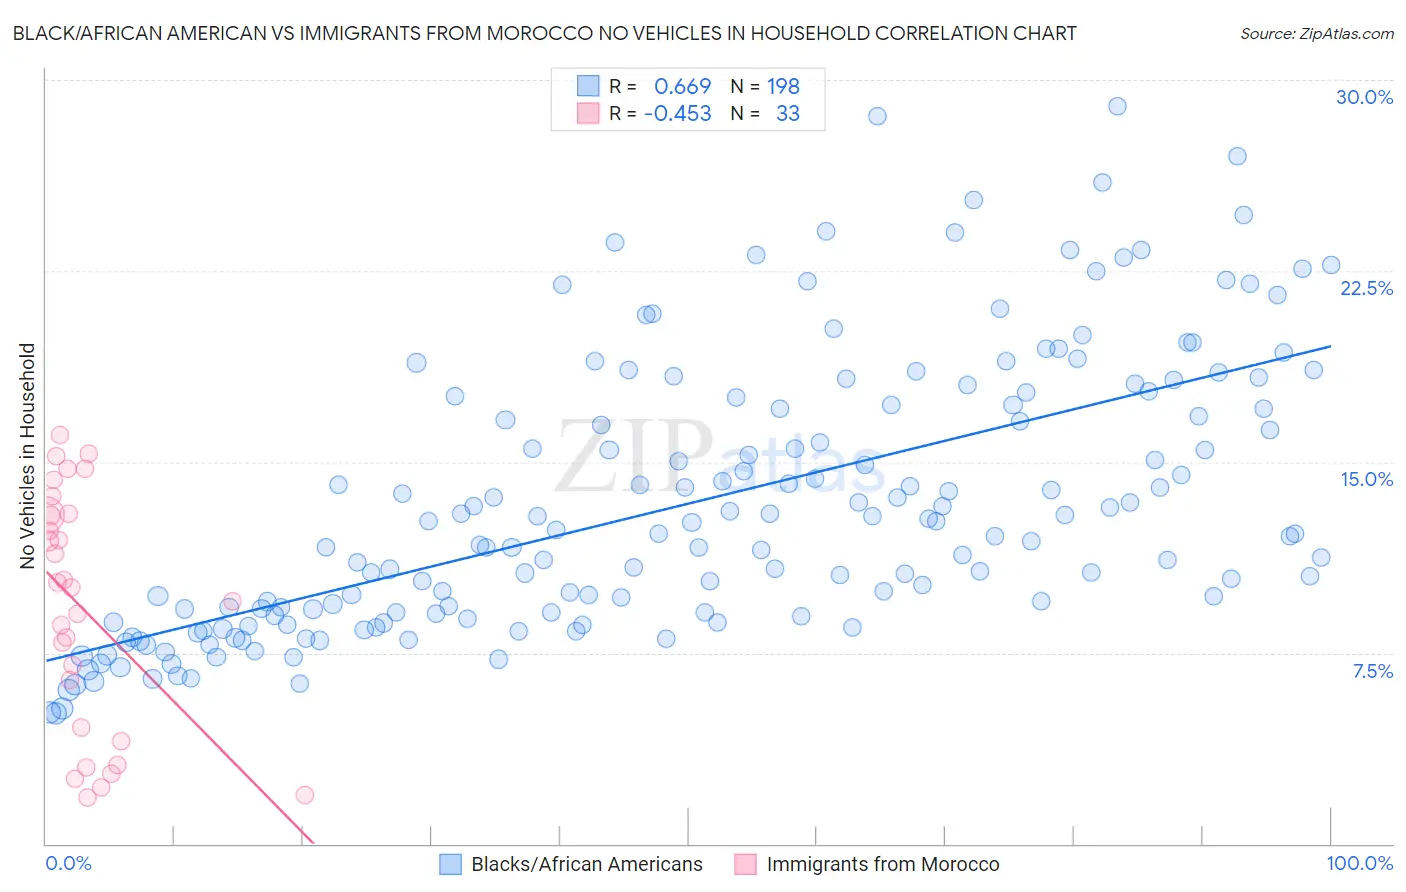
Black/African American vs Immigrants from Morocco No Vehicles in Household Correlation Chart
The statistical analysis conducted on geographies consisting of 549,724,013 people shows a significant positive correlation between the proportion of Blacks/African Americans and percentage of households with no vehicle available in the United States with a correlation coefficient (R) of 0.669 and weighted average of 11.9%. Similarly, the statistical analysis conducted on geographies consisting of 178,744,032 people shows a moderate negative correlation between the proportion of Immigrants from Morocco and percentage of households with no vehicle available in the United States with a correlation coefficient (R) of -0.453 and weighted average of 12.6%, a difference of 6.4%.
No Vehicles in Household Correlation Summary
| Measurement | Black/African American | Immigrants from Morocco |
| Minimum | 5.1% | 1.8% |
| Maximum | 29.0% | 16.0% |
| Range | 23.8% | 14.2% |
| Mean | 13.4% | 9.2% |
| Median | 12.2% | 10.0% |
| Interquartile 25% (IQ1) | 9.1% | 4.3% |
| Interquartile 75% (IQ3) | 17.3% | 13.0% |
| Interquartile Range (IQR) | 8.2% | 8.7% |
| Standard Deviation (Sample) | 5.4% | 4.6% |
| Standard Deviation (Population) | 5.3% | 4.6% |
Demographics Similar to Blacks/African Americans and Immigrants from Morocco by No Vehicles in Household
In terms of no vehicles in household, the demographic groups most similar to Blacks/African Americans are Immigrants from Serbia (11.9%, a difference of 0.25%), Egyptian (11.9%, a difference of 0.32%), Immigrants from Uruguay (11.9%, a difference of 0.65%), Honduran (12.0%, a difference of 0.92%), and Liberian (12.0%, a difference of 0.96%). Similarly, the demographic groups most similar to Immigrants from Morocco are Immigrants from Northern Africa (12.6%, a difference of 0.12%), Panamanian (12.5%, a difference of 0.67%), Immigrants from Africa (12.5%, a difference of 0.80%), Immigrants from Europe (12.5%, a difference of 0.85%), and Israeli (12.4%, a difference of 1.4%).
| Demographics | Rating | Rank | No Vehicles in Household |
| Blacks/African Americans | 1.6 /100 | #251 | Tragic 11.9% |
| Immigrants | Serbia | 1.5 /100 | #252 | Tragic 11.9% |
| Egyptians | 1.4 /100 | #253 | Tragic 11.9% |
| Immigrants | Uruguay | 1.3 /100 | #254 | Tragic 11.9% |
| Hondurans | 1.2 /100 | #255 | Tragic 12.0% |
| Liberians | 1.2 /100 | #256 | Tragic 12.0% |
| Nigerians | 0.9 /100 | #257 | Tragic 12.1% |
| South American Indians | 0.9 /100 | #258 | Tragic 12.1% |
| Immigrants | Latvia | 0.8 /100 | #259 | Tragic 12.1% |
| Macedonians | 0.7 /100 | #260 | Tragic 12.2% |
| Sub-Saharan Africans | 0.6 /100 | #261 | Tragic 12.2% |
| Immigrants | Liberia | 0.6 /100 | #262 | Tragic 12.2% |
| Immigrants | Egypt | 0.6 /100 | #263 | Tragic 12.2% |
| Immigrants | Switzerland | 0.5 /100 | #264 | Tragic 12.3% |
| Africans | 0.4 /100 | #265 | Tragic 12.3% |
| Israelis | 0.3 /100 | #266 | Tragic 12.4% |
| Immigrants | Europe | 0.3 /100 | #267 | Tragic 12.5% |
| Immigrants | Africa | 0.2 /100 | #268 | Tragic 12.5% |
| Panamanians | 0.2 /100 | #269 | Tragic 12.5% |
| Immigrants | Northern Africa | 0.2 /100 | #270 | Tragic 12.6% |
| Immigrants | Morocco | 0.2 /100 | #271 | Tragic 12.6% |