Black/African American vs Bermudan College, Under 1 year
COMPARE
Black/African American
Bermudan
College, Under 1 year
College, Under 1 year Comparison
Blacks/African Americans
Bermudans
59.4%
COLLEGE, UNDER 1 YEAR
0.0/ 100
METRIC RATING
288th/ 347
METRIC RANK
65.2%
COLLEGE, UNDER 1 YEAR
42.0/ 100
METRIC RATING
184th/ 347
METRIC RANK
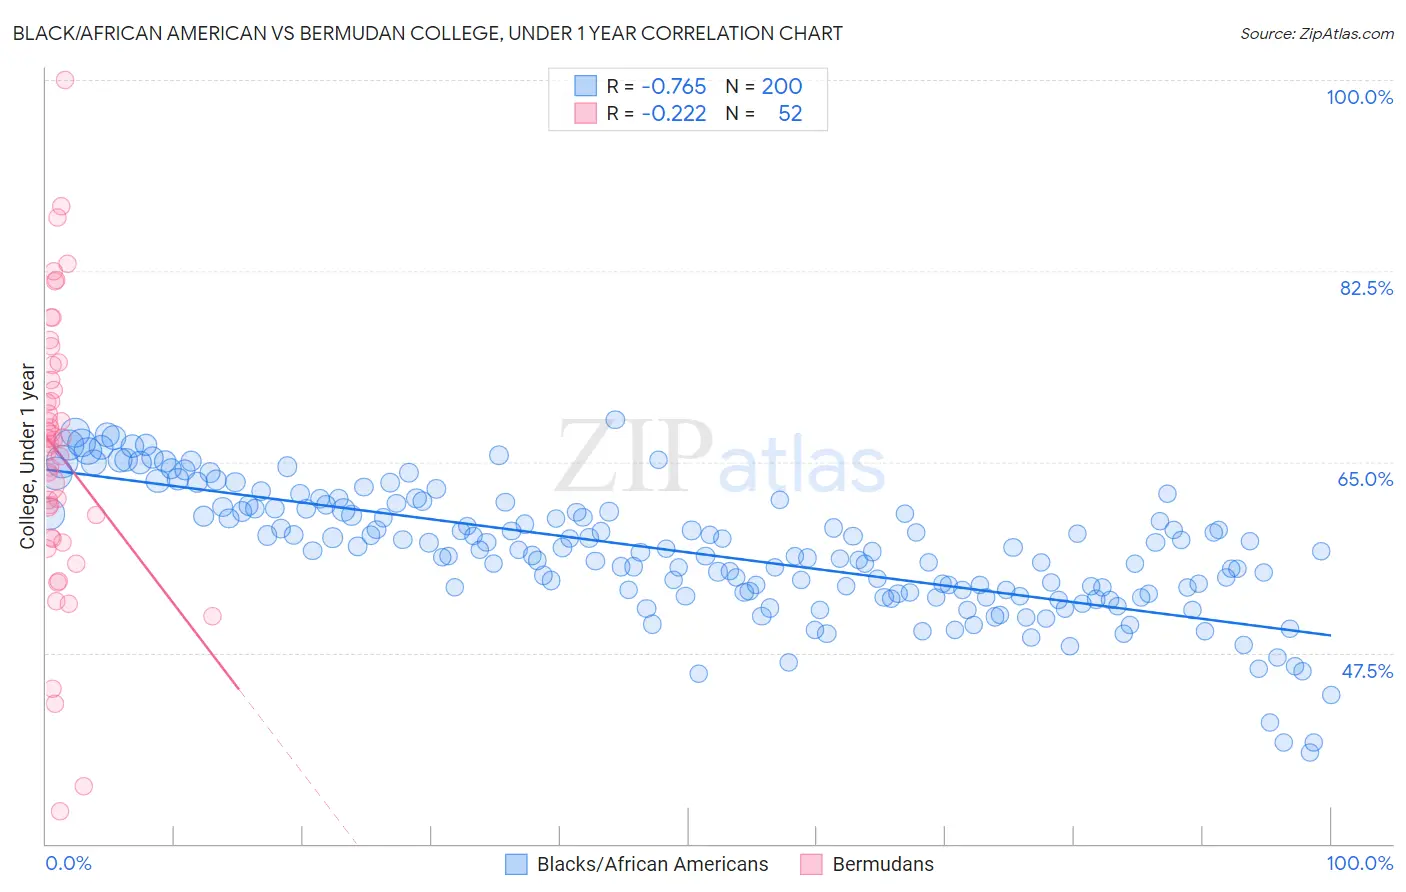
Black/African American vs Bermudan College, Under 1 year Correlation Chart
The statistical analysis conducted on geographies consisting of 566,038,640 people shows a strong negative correlation between the proportion of Blacks/African Americans and percentage of population with at least college, under 1 year education in the United States with a correlation coefficient (R) of -0.765 and weighted average of 59.4%. Similarly, the statistical analysis conducted on geographies consisting of 55,730,379 people shows a weak negative correlation between the proportion of Bermudans and percentage of population with at least college, under 1 year education in the United States with a correlation coefficient (R) of -0.222 and weighted average of 65.2%, a difference of 9.8%.
College, Under 1 year Correlation Summary
| Measurement | Black/African American | Bermudan |
| Minimum | 38.4% | 33.0% |
| Maximum | 68.9% | 100.0% |
| Range | 30.5% | 67.0% |
| Mean | 56.7% | 65.8% |
| Median | 56.8% | 66.8% |
| Interquartile 25% (IQ1) | 53.0% | 58.0% |
| Interquartile 75% (IQ3) | 60.7% | 73.2% |
| Interquartile Range (IQR) | 7.6% | 15.2% |
| Standard Deviation (Sample) | 5.8% | 12.9% |
| Standard Deviation (Population) | 5.7% | 12.7% |
Similar Demographics by College, Under 1 year
Demographics Similar to Blacks/African Americans by College, Under 1 year
In terms of college, under 1 year, the demographic groups most similar to Blacks/African Americans are Choctaw (59.3%, a difference of 0.070%), Sioux (59.4%, a difference of 0.10%), Ecuadorian (59.3%, a difference of 0.11%), Creek (59.3%, a difference of 0.20%), and Nicaraguan (59.2%, a difference of 0.24%).
| Demographics | Rating | Rank | College, Under 1 year |
| Cherokee | 0.1 /100 | #281 | Tragic 60.1% |
| Belizeans | 0.1 /100 | #282 | Tragic 60.1% |
| Immigrants | Jamaica | 0.0 /100 | #283 | Tragic 59.7% |
| Immigrants | St. Vincent and the Grenadines | 0.0 /100 | #284 | Tragic 59.6% |
| Paiute | 0.0 /100 | #285 | Tragic 59.6% |
| British West Indians | 0.0 /100 | #286 | Tragic 59.5% |
| Sioux | 0.0 /100 | #287 | Tragic 59.4% |
| Blacks/African Americans | 0.0 /100 | #288 | Tragic 59.4% |
| Choctaw | 0.0 /100 | #289 | Tragic 59.3% |
| Ecuadorians | 0.0 /100 | #290 | Tragic 59.3% |
| Creek | 0.0 /100 | #291 | Tragic 59.3% |
| Nicaraguans | 0.0 /100 | #292 | Tragic 59.2% |
| Seminole | 0.0 /100 | #293 | Tragic 59.1% |
| Immigrants | Belize | 0.0 /100 | #294 | Tragic 59.1% |
| Immigrants | Grenada | 0.0 /100 | #295 | Tragic 59.1% |
Demographics Similar to Bermudans by College, Under 1 year
In terms of college, under 1 year, the demographic groups most similar to Bermudans are Sri Lankan (65.2%, a difference of 0.010%), Immigrants from Poland (65.2%, a difference of 0.030%), Immigrants from Sierra Leone (65.1%, a difference of 0.10%), Immigrants from Africa (65.3%, a difference of 0.12%), and Spaniard (65.3%, a difference of 0.16%).
| Demographics | Rating | Rank | College, Under 1 year |
| Immigrants | North Macedonia | 48.6 /100 | #177 | Average 65.4% |
| German Russians | 48.3 /100 | #178 | Average 65.4% |
| Guamanians/Chamorros | 48.2 /100 | #179 | Average 65.4% |
| Dutch | 46.1 /100 | #180 | Average 65.3% |
| Spaniards | 45.5 /100 | #181 | Average 65.3% |
| Immigrants | Africa | 44.7 /100 | #182 | Average 65.3% |
| Immigrants | Poland | 42.6 /100 | #183 | Average 65.2% |
| Bermudans | 42.0 /100 | #184 | Average 65.2% |
| Sri Lankans | 41.7 /100 | #185 | Average 65.2% |
| Immigrants | Sierra Leone | 39.7 /100 | #186 | Fair 65.1% |
| Immigrants | Southern Europe | 34.3 /100 | #187 | Fair 64.9% |
| Immigrants | Albania | 32.0 /100 | #188 | Fair 64.9% |
| Spanish | 31.6 /100 | #189 | Fair 64.9% |
| Immigrants | Philippines | 30.1 /100 | #190 | Fair 64.8% |
| Immigrants | Armenia | 28.1 /100 | #191 | Fair 64.7% |