Black/African American vs Immigrants from Dominica No Vehicles in Household
COMPARE
Black/African American
Immigrants from Dominica
No Vehicles in Household
No Vehicles in Household Comparison
Blacks/African Americans
Immigrants from Dominica
11.9%
NO VEHICLES IN HOUSEHOLD
1.6/ 100
METRIC RATING
251st/ 347
METRIC RANK
22.2%
NO VEHICLES IN HOUSEHOLD
0.0/ 100
METRIC RATING
328th/ 347
METRIC RANK
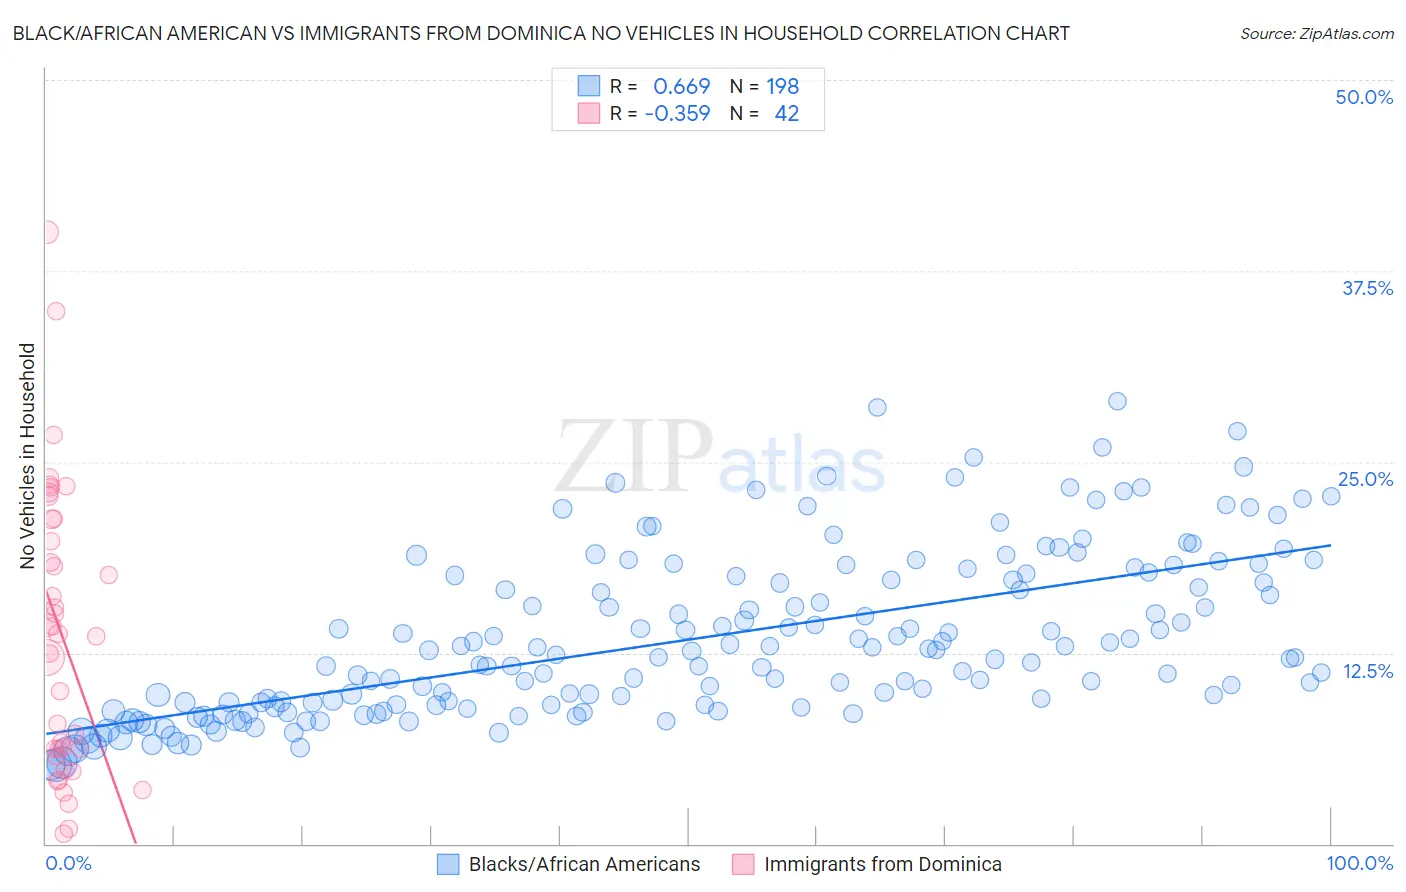
Black/African American vs Immigrants from Dominica No Vehicles in Household Correlation Chart
The statistical analysis conducted on geographies consisting of 549,724,013 people shows a significant positive correlation between the proportion of Blacks/African Americans and percentage of households with no vehicle available in the United States with a correlation coefficient (R) of 0.669 and weighted average of 11.9%. Similarly, the statistical analysis conducted on geographies consisting of 83,752,468 people shows a mild negative correlation between the proportion of Immigrants from Dominica and percentage of households with no vehicle available in the United States with a correlation coefficient (R) of -0.359 and weighted average of 22.2%, a difference of 87.5%.
No Vehicles in Household Correlation Summary
| Measurement | Black/African American | Immigrants from Dominica |
| Minimum | 5.1% | 0.64% |
| Maximum | 29.0% | 40.0% |
| Range | 23.8% | 39.4% |
| Mean | 13.4% | 13.7% |
| Median | 12.2% | 13.7% |
| Interquartile 25% (IQ1) | 9.1% | 6.2% |
| Interquartile 75% (IQ3) | 17.3% | 21.2% |
| Interquartile Range (IQR) | 8.2% | 15.1% |
| Standard Deviation (Sample) | 5.4% | 9.3% |
| Standard Deviation (Population) | 5.3% | 9.2% |
Similar Demographics by No Vehicles in Household
Demographics Similar to Blacks/African Americans by No Vehicles in Household
In terms of no vehicles in household, the demographic groups most similar to Blacks/African Americans are Immigrants from Serbia (11.9%, a difference of 0.25%), Egyptian (11.9%, a difference of 0.32%), Paiute (11.8%, a difference of 0.35%), Immigrants from Nigeria (11.8%, a difference of 0.57%), and Immigrants from Belgium (11.8%, a difference of 0.60%).
| Demographics | Rating | Rank | No Vehicles in Household |
| Immigrants | Portugal | 2.2 /100 | #244 | Tragic 11.7% |
| Immigrants | Honduras | 2.1 /100 | #245 | Tragic 11.8% |
| Menominee | 2.0 /100 | #246 | Tragic 11.8% |
| Immigrants | Czechoslovakia | 2.0 /100 | #247 | Tragic 11.8% |
| Immigrants | Belgium | 1.9 /100 | #248 | Tragic 11.8% |
| Immigrants | Nigeria | 1.9 /100 | #249 | Tragic 11.8% |
| Paiute | 1.8 /100 | #250 | Tragic 11.8% |
| Blacks/African Americans | 1.6 /100 | #251 | Tragic 11.9% |
| Immigrants | Serbia | 1.5 /100 | #252 | Tragic 11.9% |
| Egyptians | 1.4 /100 | #253 | Tragic 11.9% |
| Immigrants | Uruguay | 1.3 /100 | #254 | Tragic 11.9% |
| Hondurans | 1.2 /100 | #255 | Tragic 12.0% |
| Liberians | 1.2 /100 | #256 | Tragic 12.0% |
| Nigerians | 0.9 /100 | #257 | Tragic 12.1% |
| South American Indians | 0.9 /100 | #258 | Tragic 12.1% |
Demographics Similar to Immigrants from Dominica by No Vehicles in Household
In terms of no vehicles in household, the demographic groups most similar to Immigrants from Dominica are Ecuadorian (22.8%, a difference of 2.3%), Immigrants from Senegal (21.1%, a difference of 5.1%), West Indian (23.7%, a difference of 6.6%), Trinidadian and Tobagonian (23.7%, a difference of 6.8%), and Immigrants from Ecuador (23.8%, a difference of 7.2%).
| Demographics | Rating | Rank | No Vehicles in Household |
| Jamaicans | 0.0 /100 | #321 | Tragic 17.9% |
| Immigrants | Cabo Verde | 0.0 /100 | #322 | Tragic 18.4% |
| Immigrants | Yemen | 0.0 /100 | #323 | Tragic 19.5% |
| Immigrants | Caribbean | 0.0 /100 | #324 | Tragic 19.6% |
| Senegalese | 0.0 /100 | #325 | Tragic 19.8% |
| Immigrants | West Indies | 0.0 /100 | #326 | Tragic 20.5% |
| Immigrants | Senegal | 0.0 /100 | #327 | Tragic 21.1% |
| Immigrants | Dominica | 0.0 /100 | #328 | Tragic 22.2% |
| Ecuadorians | 0.0 /100 | #329 | Tragic 22.8% |
| West Indians | 0.0 /100 | #330 | Tragic 23.7% |
| Trinidadians and Tobagonians | 0.0 /100 | #331 | Tragic 23.7% |
| Immigrants | Ecuador | 0.0 /100 | #332 | Tragic 23.8% |
| Immigrants | Trinidad and Tobago | 0.0 /100 | #333 | Tragic 24.6% |
| Immigrants | Bangladesh | 0.0 /100 | #334 | Tragic 25.8% |
| Barbadians | 0.0 /100 | #335 | Tragic 26.1% |