Black/African American vs Immigrants from Zaire No Vehicles in Household
COMPARE
Black/African American
Immigrants from Zaire
No Vehicles in Household
No Vehicles in Household Comparison
Blacks/African Americans
Immigrants from Zaire
11.9%
NO VEHICLES IN HOUSEHOLD
1.6/ 100
METRIC RATING
251st/ 347
METRIC RANK
11.2%
NO VEHICLES IN HOUSEHOLD
9.6/ 100
METRIC RATING
220th/ 347
METRIC RANK
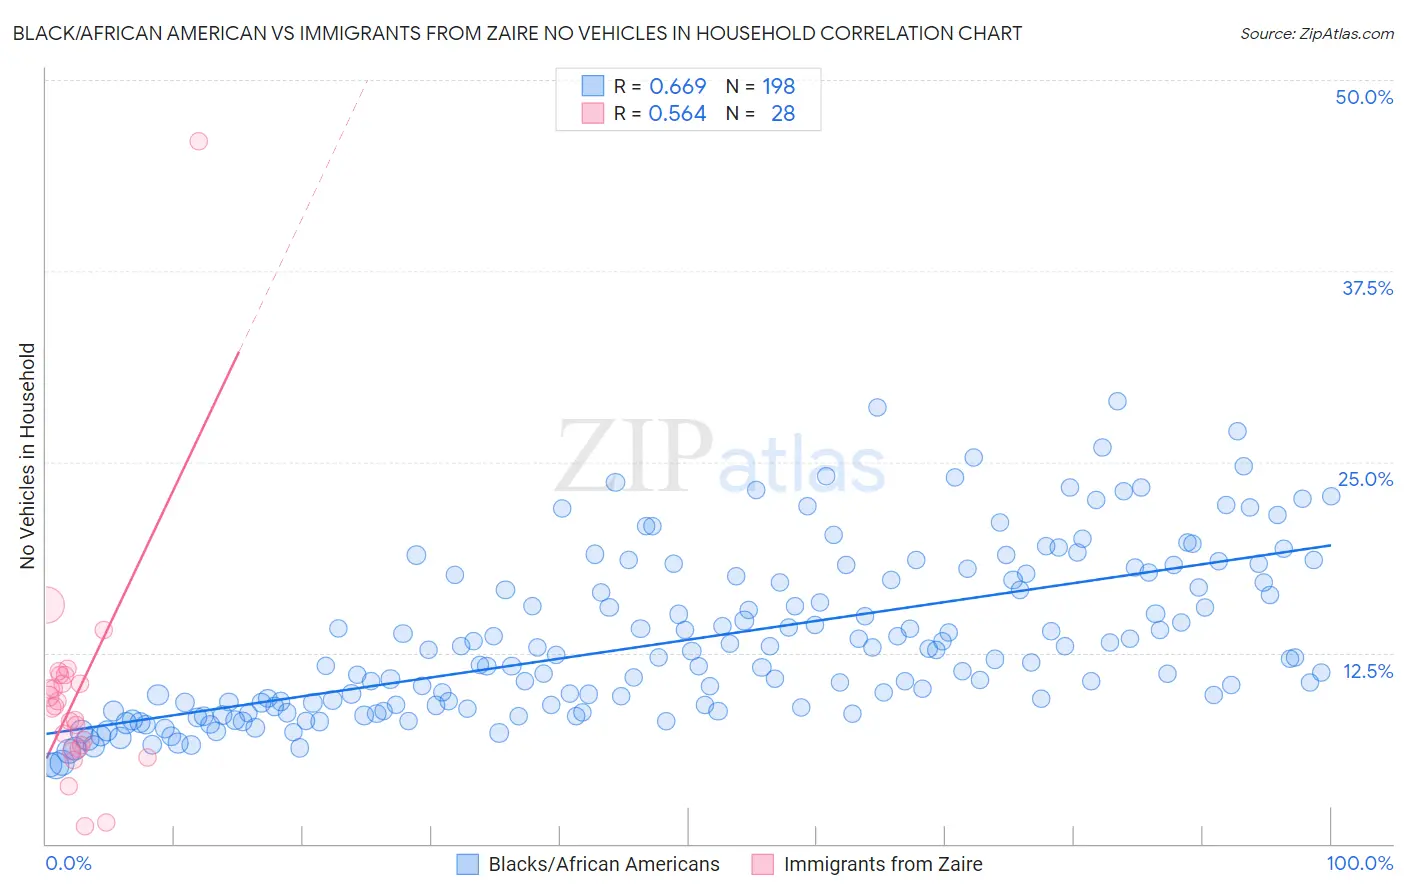
Black/African American vs Immigrants from Zaire No Vehicles in Household Correlation Chart
The statistical analysis conducted on geographies consisting of 549,724,013 people shows a significant positive correlation between the proportion of Blacks/African Americans and percentage of households with no vehicle available in the United States with a correlation coefficient (R) of 0.669 and weighted average of 11.9%. Similarly, the statistical analysis conducted on geographies consisting of 107,219,948 people shows a substantial positive correlation between the proportion of Immigrants from Zaire and percentage of households with no vehicle available in the United States with a correlation coefficient (R) of 0.564 and weighted average of 11.2%, a difference of 5.9%.
No Vehicles in Household Correlation Summary
| Measurement | Black/African American | Immigrants from Zaire |
| Minimum | 5.1% | 1.2% |
| Maximum | 29.0% | 46.0% |
| Range | 23.8% | 44.8% |
| Mean | 13.4% | 9.7% |
| Median | 12.2% | 9.0% |
| Interquartile 25% (IQ1) | 9.1% | 6.4% |
| Interquartile 75% (IQ3) | 17.3% | 10.8% |
| Interquartile Range (IQR) | 8.2% | 4.4% |
| Standard Deviation (Sample) | 5.4% | 7.8% |
| Standard Deviation (Population) | 5.3% | 7.7% |
Similar Demographics by No Vehicles in Household
Demographics Similar to Blacks/African Americans by No Vehicles in Household
In terms of no vehicles in household, the demographic groups most similar to Blacks/African Americans are Immigrants from Serbia (11.9%, a difference of 0.25%), Egyptian (11.9%, a difference of 0.32%), Paiute (11.8%, a difference of 0.35%), Immigrants from Nigeria (11.8%, a difference of 0.57%), and Immigrants from Belgium (11.8%, a difference of 0.60%).
| Demographics | Rating | Rank | No Vehicles in Household |
| Immigrants | Portugal | 2.2 /100 | #244 | Tragic 11.7% |
| Immigrants | Honduras | 2.1 /100 | #245 | Tragic 11.8% |
| Menominee | 2.0 /100 | #246 | Tragic 11.8% |
| Immigrants | Czechoslovakia | 2.0 /100 | #247 | Tragic 11.8% |
| Immigrants | Belgium | 1.9 /100 | #248 | Tragic 11.8% |
| Immigrants | Nigeria | 1.9 /100 | #249 | Tragic 11.8% |
| Paiute | 1.8 /100 | #250 | Tragic 11.8% |
| Blacks/African Americans | 1.6 /100 | #251 | Tragic 11.9% |
| Immigrants | Serbia | 1.5 /100 | #252 | Tragic 11.9% |
| Egyptians | 1.4 /100 | #253 | Tragic 11.9% |
| Immigrants | Uruguay | 1.3 /100 | #254 | Tragic 11.9% |
| Hondurans | 1.2 /100 | #255 | Tragic 12.0% |
| Liberians | 1.2 /100 | #256 | Tragic 12.0% |
| Nigerians | 0.9 /100 | #257 | Tragic 12.1% |
| South American Indians | 0.9 /100 | #258 | Tragic 12.1% |
Demographics Similar to Immigrants from Zaire by No Vehicles in Household
In terms of no vehicles in household, the demographic groups most similar to Immigrants from Zaire are Argentinean (11.2%, a difference of 0.010%), Immigrants from Guatemala (11.2%, a difference of 0.14%), Dutch West Indian (11.2%, a difference of 0.24%), Immigrants from Argentina (11.2%, a difference of 0.36%), and Immigrants from Sri Lanka (11.2%, a difference of 0.37%).
| Demographics | Rating | Rank | No Vehicles in Household |
| Immigrants | Hungary | 12.3 /100 | #213 | Poor 11.1% |
| Immigrants | Denmark | 12.1 /100 | #214 | Poor 11.1% |
| Immigrants | Sri Lanka | 10.6 /100 | #215 | Poor 11.2% |
| Immigrants | Argentina | 10.6 /100 | #216 | Poor 11.2% |
| Dutch West Indians | 10.2 /100 | #217 | Poor 11.2% |
| Immigrants | Guatemala | 10.0 /100 | #218 | Tragic 11.2% |
| Argentineans | 9.6 /100 | #219 | Tragic 11.2% |
| Immigrants | Zaire | 9.6 /100 | #220 | Tragic 11.2% |
| Peruvians | 8.4 /100 | #221 | Tragic 11.2% |
| Immigrants | South America | 8.0 /100 | #222 | Tragic 11.3% |
| Uruguayans | 7.7 /100 | #223 | Tragic 11.3% |
| Immigrants | Hong Kong | 7.2 /100 | #224 | Tragic 11.3% |
| Immigrants | Sierra Leone | 6.4 /100 | #225 | Tragic 11.3% |
| Immigrants | Somalia | 5.4 /100 | #226 | Tragic 11.4% |
| Immigrants | Pakistan | 5.4 /100 | #227 | Tragic 11.4% |