Black/African American vs Sierra Leonean No Vehicles in Household
COMPARE
Black/African American
Sierra Leonean
No Vehicles in Household
No Vehicles in Household Comparison
Blacks/African Americans
Sierra Leoneans
11.9%
NO VEHICLES IN HOUSEHOLD
1.6/ 100
METRIC RATING
251st/ 347
METRIC RANK
11.0%
NO VEHICLES IN HOUSEHOLD
15.7/ 100
METRIC RATING
207th/ 347
METRIC RANK
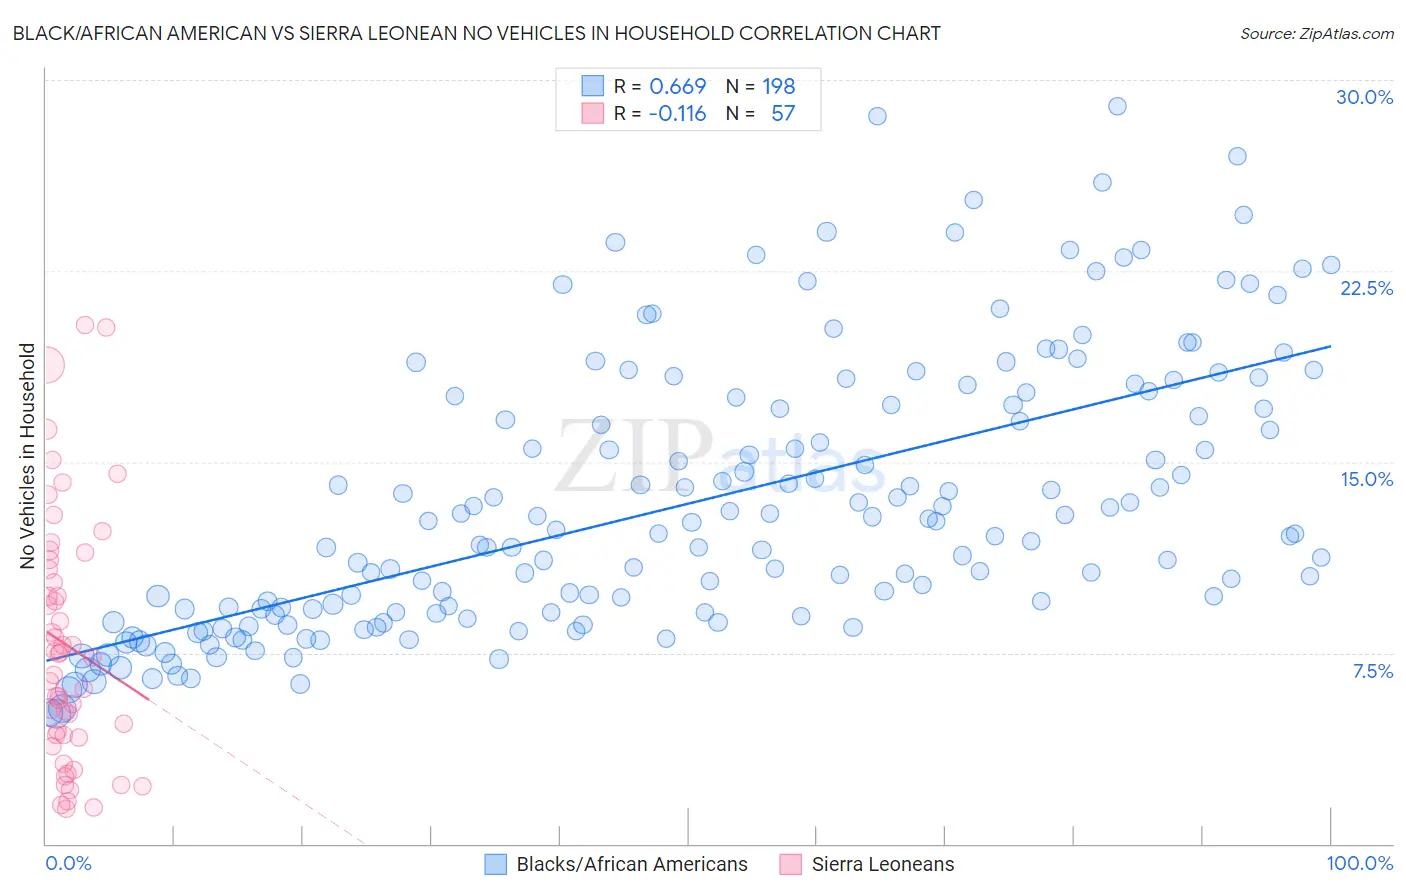
Black/African American vs Sierra Leonean No Vehicles in Household Correlation Chart
The statistical analysis conducted on geographies consisting of 549,724,013 people shows a significant positive correlation between the proportion of Blacks/African Americans and percentage of households with no vehicle available in the United States with a correlation coefficient (R) of 0.669 and weighted average of 11.9%. Similarly, the statistical analysis conducted on geographies consisting of 83,300,875 people shows a poor negative correlation between the proportion of Sierra Leoneans and percentage of households with no vehicle available in the United States with a correlation coefficient (R) of -0.116 and weighted average of 11.0%, a difference of 7.8%.
No Vehicles in Household Correlation Summary
| Measurement | Black/African American | Sierra Leonean |
| Minimum | 5.1% | 1.4% |
| Maximum | 29.0% | 20.4% |
| Range | 23.8% | 19.0% |
| Mean | 13.4% | 7.8% |
| Median | 12.2% | 7.3% |
| Interquartile 25% (IQ1) | 9.1% | 4.2% |
| Interquartile 75% (IQ3) | 17.3% | 11.0% |
| Interquartile Range (IQR) | 8.2% | 6.8% |
| Standard Deviation (Sample) | 5.4% | 4.8% |
| Standard Deviation (Population) | 5.3% | 4.8% |
Similar Demographics by No Vehicles in Household
Demographics Similar to Blacks/African Americans by No Vehicles in Household
In terms of no vehicles in household, the demographic groups most similar to Blacks/African Americans are Immigrants from Serbia (11.9%, a difference of 0.25%), Egyptian (11.9%, a difference of 0.32%), Paiute (11.8%, a difference of 0.35%), Immigrants from Nigeria (11.8%, a difference of 0.57%), and Immigrants from Belgium (11.8%, a difference of 0.60%).
| Demographics | Rating | Rank | No Vehicles in Household |
| Immigrants | Portugal | 2.2 /100 | #244 | Tragic 11.7% |
| Immigrants | Honduras | 2.1 /100 | #245 | Tragic 11.8% |
| Menominee | 2.0 /100 | #246 | Tragic 11.8% |
| Immigrants | Czechoslovakia | 2.0 /100 | #247 | Tragic 11.8% |
| Immigrants | Belgium | 1.9 /100 | #248 | Tragic 11.8% |
| Immigrants | Nigeria | 1.9 /100 | #249 | Tragic 11.8% |
| Paiute | 1.8 /100 | #250 | Tragic 11.8% |
| Blacks/African Americans | 1.6 /100 | #251 | Tragic 11.9% |
| Immigrants | Serbia | 1.5 /100 | #252 | Tragic 11.9% |
| Egyptians | 1.4 /100 | #253 | Tragic 11.9% |
| Immigrants | Uruguay | 1.3 /100 | #254 | Tragic 11.9% |
| Hondurans | 1.2 /100 | #255 | Tragic 12.0% |
| Liberians | 1.2 /100 | #256 | Tragic 12.0% |
| Nigerians | 0.9 /100 | #257 | Tragic 12.1% |
| South American Indians | 0.9 /100 | #258 | Tragic 12.1% |
Demographics Similar to Sierra Leoneans by No Vehicles in Household
In terms of no vehicles in household, the demographic groups most similar to Sierra Leoneans are Immigrants from Italy (11.0%, a difference of 0.010%), Immigrants from Chile (11.0%, a difference of 0.050%), Somali (11.0%, a difference of 0.050%), Pennsylvania German (11.0%, a difference of 0.050%), and Guatemalan (11.0%, a difference of 0.10%).
| Demographics | Rating | Rank | No Vehicles in Household |
| Cambodians | 19.6 /100 | #200 | Poor 10.9% |
| Immigrants | Western Europe | 19.1 /100 | #201 | Poor 10.9% |
| Romanians | 17.9 /100 | #202 | Poor 10.9% |
| Iroquois | 17.6 /100 | #203 | Poor 10.9% |
| Guatemalans | 16.1 /100 | #204 | Poor 11.0% |
| Immigrants | Chile | 15.9 /100 | #205 | Poor 11.0% |
| Somalis | 15.9 /100 | #206 | Poor 11.0% |
| Sierra Leoneans | 15.7 /100 | #207 | Poor 11.0% |
| Immigrants | Italy | 15.6 /100 | #208 | Poor 11.0% |
| Pennsylvania Germans | 15.5 /100 | #209 | Poor 11.0% |
| Apache | 14.8 /100 | #210 | Poor 11.0% |
| Crow | 14.2 /100 | #211 | Poor 11.0% |
| Immigrants | Western Asia | 13.9 /100 | #212 | Poor 11.0% |
| Immigrants | Hungary | 12.3 /100 | #213 | Poor 11.1% |
| Immigrants | Denmark | 12.1 /100 | #214 | Poor 11.1% |