Black/African American vs South American Indian No Vehicles in Household
COMPARE
Black/African American
South American Indian
No Vehicles in Household
No Vehicles in Household Comparison
Blacks/African Americans
South American Indians
11.9%
NO VEHICLES IN HOUSEHOLD
1.6/ 100
METRIC RATING
251st/ 347
METRIC RANK
12.1%
NO VEHICLES IN HOUSEHOLD
0.9/ 100
METRIC RATING
258th/ 347
METRIC RANK
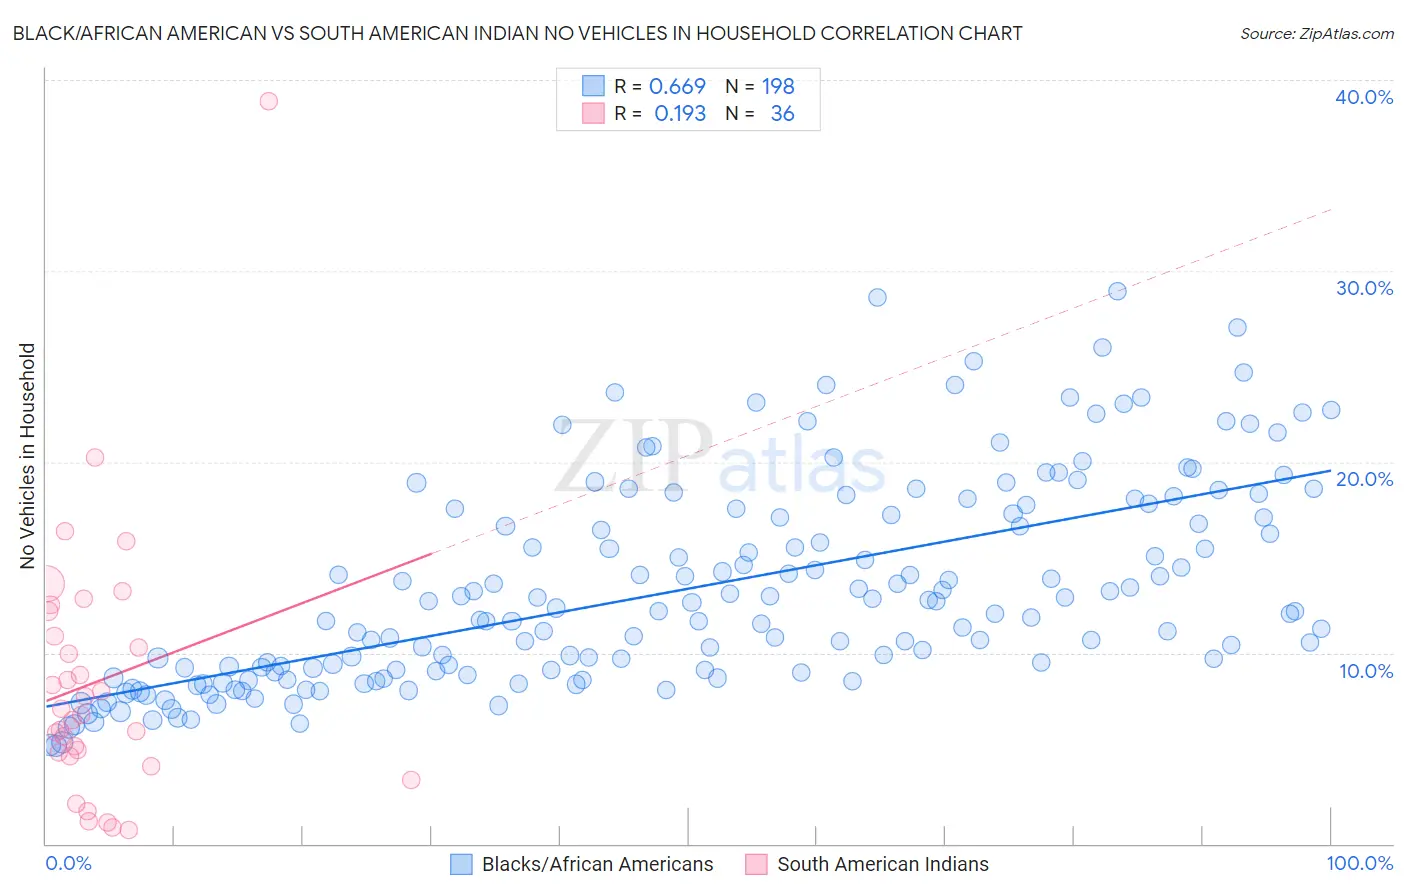
Black/African American vs South American Indian No Vehicles in Household Correlation Chart
The statistical analysis conducted on geographies consisting of 549,724,013 people shows a significant positive correlation between the proportion of Blacks/African Americans and percentage of households with no vehicle available in the United States with a correlation coefficient (R) of 0.669 and weighted average of 11.9%. Similarly, the statistical analysis conducted on geographies consisting of 164,483,116 people shows a poor positive correlation between the proportion of South American Indians and percentage of households with no vehicle available in the United States with a correlation coefficient (R) of 0.193 and weighted average of 12.1%, a difference of 1.7%.
No Vehicles in Household Correlation Summary
| Measurement | Black/African American | South American Indian |
| Minimum | 5.1% | 0.72% |
| Maximum | 29.0% | 38.9% |
| Range | 23.8% | 38.2% |
| Mean | 13.4% | 8.5% |
| Median | 12.2% | 6.9% |
| Interquartile 25% (IQ1) | 9.1% | 4.7% |
| Interquartile 75% (IQ3) | 17.3% | 11.5% |
| Interquartile Range (IQR) | 8.2% | 6.9% |
| Standard Deviation (Sample) | 5.4% | 7.0% |
| Standard Deviation (Population) | 5.3% | 6.9% |
Demographics Similar to Blacks/African Americans and South American Indians by No Vehicles in Household
In terms of no vehicles in household, the demographic groups most similar to Blacks/African Americans are Immigrants from Serbia (11.9%, a difference of 0.25%), Egyptian (11.9%, a difference of 0.32%), Paiute (11.8%, a difference of 0.35%), Immigrants from Nigeria (11.8%, a difference of 0.57%), and Immigrants from Belgium (11.8%, a difference of 0.60%). Similarly, the demographic groups most similar to South American Indians are Nigerian (12.1%, a difference of 0.020%), Immigrants from Latvia (12.1%, a difference of 0.24%), Liberian (12.0%, a difference of 0.76%), Macedonian (12.2%, a difference of 0.80%), and Honduran (12.0%, a difference of 0.81%).
| Demographics | Rating | Rank | No Vehicles in Household |
| Immigrants | Portugal | 2.2 /100 | #244 | Tragic 11.7% |
| Immigrants | Honduras | 2.1 /100 | #245 | Tragic 11.8% |
| Menominee | 2.0 /100 | #246 | Tragic 11.8% |
| Immigrants | Czechoslovakia | 2.0 /100 | #247 | Tragic 11.8% |
| Immigrants | Belgium | 1.9 /100 | #248 | Tragic 11.8% |
| Immigrants | Nigeria | 1.9 /100 | #249 | Tragic 11.8% |
| Paiute | 1.8 /100 | #250 | Tragic 11.8% |
| Blacks/African Americans | 1.6 /100 | #251 | Tragic 11.9% |
| Immigrants | Serbia | 1.5 /100 | #252 | Tragic 11.9% |
| Egyptians | 1.4 /100 | #253 | Tragic 11.9% |
| Immigrants | Uruguay | 1.3 /100 | #254 | Tragic 11.9% |
| Hondurans | 1.2 /100 | #255 | Tragic 12.0% |
| Liberians | 1.2 /100 | #256 | Tragic 12.0% |
| Nigerians | 0.9 /100 | #257 | Tragic 12.1% |
| South American Indians | 0.9 /100 | #258 | Tragic 12.1% |
| Immigrants | Latvia | 0.8 /100 | #259 | Tragic 12.1% |
| Macedonians | 0.7 /100 | #260 | Tragic 12.2% |
| Sub-Saharan Africans | 0.6 /100 | #261 | Tragic 12.2% |
| Immigrants | Liberia | 0.6 /100 | #262 | Tragic 12.2% |
| Immigrants | Egypt | 0.6 /100 | #263 | Tragic 12.2% |
| Immigrants | Switzerland | 0.5 /100 | #264 | Tragic 12.3% |