Black/African American vs Bermudan 12th Grade, No Diploma
COMPARE
Black/African American
Bermudan
12th Grade, No Diploma
12th Grade, No Diploma Comparison
Blacks/African Americans
Bermudans
89.3%
12TH GRADE, NO DIPLOMA
0.1/ 100
METRIC RATING
271st/ 347
METRIC RANK
91.2%
12TH GRADE, NO DIPLOMA
50.8/ 100
METRIC RATING
172nd/ 347
METRIC RANK
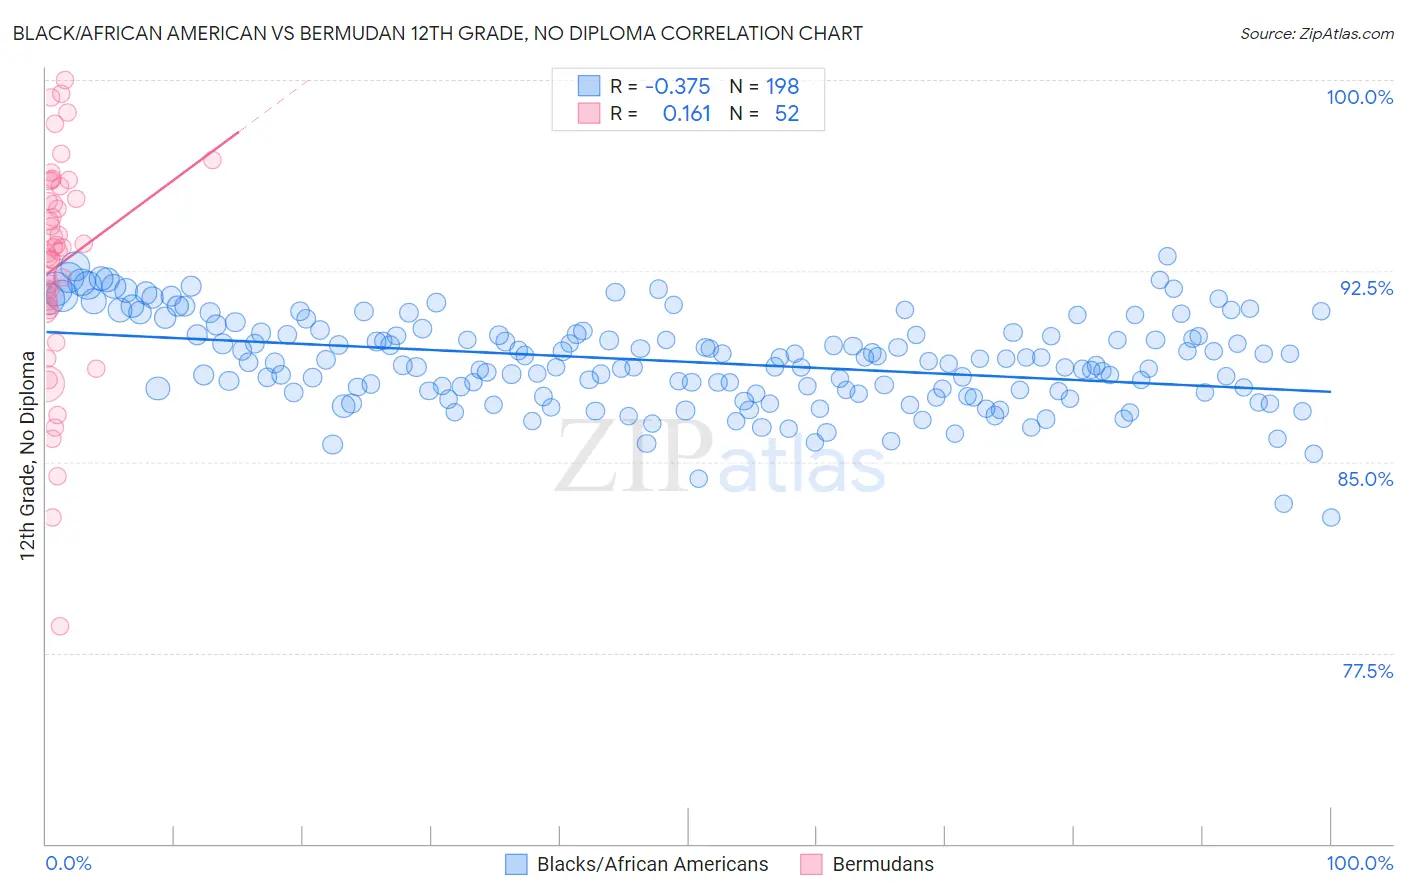
Black/African American vs Bermudan 12th Grade, No Diploma Correlation Chart
The statistical analysis conducted on geographies consisting of 566,032,166 people shows a mild negative correlation between the proportion of Blacks/African Americans and percentage of population with at least 12th grade (no diploma) education in the United States with a correlation coefficient (R) of -0.375 and weighted average of 89.3%. Similarly, the statistical analysis conducted on geographies consisting of 55,730,379 people shows a poor positive correlation between the proportion of Bermudans and percentage of population with at least 12th grade (no diploma) education in the United States with a correlation coefficient (R) of 0.161 and weighted average of 91.2%, a difference of 2.1%.
12th Grade, No Diploma Correlation Summary
| Measurement | Black/African American | Bermudan |
| Minimum | 82.8% | 78.6% |
| Maximum | 93.1% | 100.0% |
| Range | 10.3% | 21.4% |
| Mean | 88.9% | 92.7% |
| Median | 88.9% | 93.4% |
| Interquartile 25% (IQ1) | 87.7% | 91.0% |
| Interquartile 75% (IQ3) | 90.0% | 95.6% |
| Interquartile Range (IQR) | 2.3% | 4.5% |
| Standard Deviation (Sample) | 1.8% | 4.3% |
| Standard Deviation (Population) | 1.8% | 4.2% |
Similar Demographics by 12th Grade, No Diploma
Demographics Similar to Blacks/African Americans by 12th Grade, No Diploma
In terms of 12th grade, no diploma, the demographic groups most similar to Blacks/African Americans are Bangladeshi (89.3%, a difference of 0.0%), Malaysian (89.2%, a difference of 0.010%), U.S. Virgin Islander (89.3%, a difference of 0.050%), Immigrants from Trinidad and Tobago (89.3%, a difference of 0.080%), and West Indian (89.3%, a difference of 0.10%).
| Demographics | Rating | Rank | 12th Grade, No Diploma |
| Sri Lankans | 0.2 /100 | #264 | Tragic 89.4% |
| Trinidadians and Tobagonians | 0.2 /100 | #265 | Tragic 89.4% |
| Seminole | 0.2 /100 | #266 | Tragic 89.4% |
| West Indians | 0.2 /100 | #267 | Tragic 89.3% |
| Immigrants | Trinidad and Tobago | 0.1 /100 | #268 | Tragic 89.3% |
| U.S. Virgin Islanders | 0.1 /100 | #269 | Tragic 89.3% |
| Bangladeshis | 0.1 /100 | #270 | Tragic 89.3% |
| Blacks/African Americans | 0.1 /100 | #271 | Tragic 89.3% |
| Malaysians | 0.1 /100 | #272 | Tragic 89.2% |
| Barbadians | 0.1 /100 | #273 | Tragic 89.1% |
| Cajuns | 0.1 /100 | #274 | Tragic 89.1% |
| Immigrants | Congo | 0.1 /100 | #275 | Tragic 89.0% |
| Ute | 0.1 /100 | #276 | Tragic 89.0% |
| Immigrants | Barbados | 0.0 /100 | #277 | Tragic 89.0% |
| Immigrants | St. Vincent and the Grenadines | 0.0 /100 | #278 | Tragic 88.9% |
Demographics Similar to Bermudans by 12th Grade, No Diploma
In terms of 12th grade, no diploma, the demographic groups most similar to Bermudans are Immigrants from Morocco (91.2%, a difference of 0.010%), Bolivian (91.2%, a difference of 0.010%), Immigrants from Nepal (91.2%, a difference of 0.010%), Delaware (91.2%, a difference of 0.020%), and Immigrants from Western Asia (91.2%, a difference of 0.020%).
| Demographics | Rating | Rank | 12th Grade, No Diploma |
| Alsatians | 58.3 /100 | #165 | Average 91.3% |
| Hmong | 58.0 /100 | #166 | Average 91.3% |
| Immigrants | Malaysia | 57.8 /100 | #167 | Average 91.3% |
| Cree | 57.0 /100 | #168 | Average 91.2% |
| Immigrants | Indonesia | 54.9 /100 | #169 | Average 91.2% |
| Delaware | 52.8 /100 | #170 | Average 91.2% |
| Immigrants | Morocco | 51.4 /100 | #171 | Average 91.2% |
| Bermudans | 50.8 /100 | #172 | Average 91.2% |
| Bolivians | 50.4 /100 | #173 | Average 91.2% |
| Immigrants | Nepal | 50.0 /100 | #174 | Average 91.2% |
| Immigrants | Western Asia | 49.0 /100 | #175 | Average 91.2% |
| Iroquois | 48.5 /100 | #176 | Average 91.1% |
| Sierra Leoneans | 47.7 /100 | #177 | Average 91.1% |
| Spanish | 43.7 /100 | #178 | Average 91.1% |
| Immigrants | Chile | 43.3 /100 | #179 | Average 91.1% |