Black/African American vs Yup'ik No Vehicles in Household
COMPARE
Black/African American
Yup'ik
No Vehicles in Household
No Vehicles in Household Comparison
Blacks/African Americans
Yup'ik
11.9%
NO VEHICLES IN HOUSEHOLD
1.6/ 100
METRIC RATING
251st/ 347
METRIC RANK
45.9%
NO VEHICLES IN HOUSEHOLD
0.0/ 100
METRIC RATING
347th/ 347
METRIC RANK
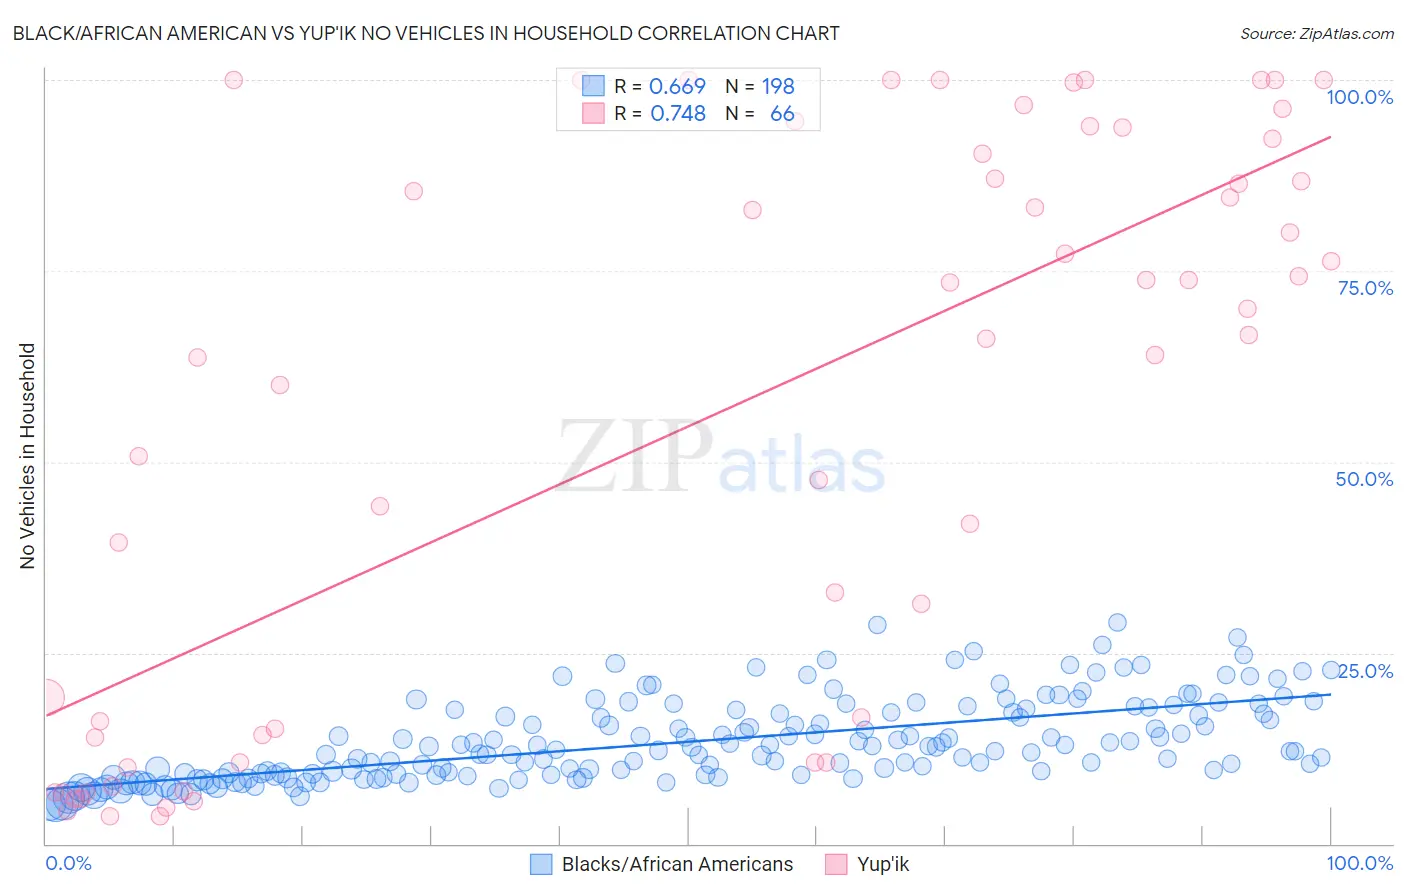
Black/African American vs Yup'ik No Vehicles in Household Correlation Chart
The statistical analysis conducted on geographies consisting of 549,724,013 people shows a significant positive correlation between the proportion of Blacks/African Americans and percentage of households with no vehicle available in the United States with a correlation coefficient (R) of 0.669 and weighted average of 11.9%. Similarly, the statistical analysis conducted on geographies consisting of 39,930,704 people shows a strong positive correlation between the proportion of Yup'ik and percentage of households with no vehicle available in the United States with a correlation coefficient (R) of 0.748 and weighted average of 45.9%, a difference of 287.0%.
No Vehicles in Household Correlation Summary
| Measurement | Black/African American | Yup'ik |
| Minimum | 5.1% | 3.5% |
| Maximum | 29.0% | 100.0% |
| Range | 23.8% | 96.5% |
| Mean | 13.4% | 55.6% |
| Median | 12.2% | 66.4% |
| Interquartile 25% (IQ1) | 9.1% | 14.0% |
| Interquartile 75% (IQ3) | 17.3% | 90.4% |
| Interquartile Range (IQR) | 8.2% | 76.4% |
| Standard Deviation (Sample) | 5.4% | 37.0% |
| Standard Deviation (Population) | 5.3% | 36.7% |
Similar Demographics by No Vehicles in Household
Demographics Similar to Blacks/African Americans by No Vehicles in Household
In terms of no vehicles in household, the demographic groups most similar to Blacks/African Americans are Immigrants from Serbia (11.9%, a difference of 0.25%), Egyptian (11.9%, a difference of 0.32%), Paiute (11.8%, a difference of 0.35%), Immigrants from Nigeria (11.8%, a difference of 0.57%), and Immigrants from Belgium (11.8%, a difference of 0.60%).
| Demographics | Rating | Rank | No Vehicles in Household |
| Immigrants | Portugal | 2.2 /100 | #244 | Tragic 11.7% |
| Immigrants | Honduras | 2.1 /100 | #245 | Tragic 11.8% |
| Menominee | 2.0 /100 | #246 | Tragic 11.8% |
| Immigrants | Czechoslovakia | 2.0 /100 | #247 | Tragic 11.8% |
| Immigrants | Belgium | 1.9 /100 | #248 | Tragic 11.8% |
| Immigrants | Nigeria | 1.9 /100 | #249 | Tragic 11.8% |
| Paiute | 1.8 /100 | #250 | Tragic 11.8% |
| Blacks/African Americans | 1.6 /100 | #251 | Tragic 11.9% |
| Immigrants | Serbia | 1.5 /100 | #252 | Tragic 11.9% |
| Egyptians | 1.4 /100 | #253 | Tragic 11.9% |
| Immigrants | Uruguay | 1.3 /100 | #254 | Tragic 11.9% |
| Hondurans | 1.2 /100 | #255 | Tragic 12.0% |
| Liberians | 1.2 /100 | #256 | Tragic 12.0% |
| Nigerians | 0.9 /100 | #257 | Tragic 12.1% |
| South American Indians | 0.9 /100 | #258 | Tragic 12.1% |
Demographics Similar to Yup'ik by No Vehicles in Household
In terms of no vehicles in household, the demographic groups most similar to Yup'ik are Immigrants from Grenada (37.5%, a difference of 22.5%), Immigrants from St. Vincent and the Grenadines (35.4%, a difference of 29.6%), Immigrants from Dominican Republic (31.4%, a difference of 46.0%), Inupiat (29.9%, a difference of 53.6%), and British West Indian (29.7%, a difference of 54.3%).
| Demographics | Rating | Rank | No Vehicles in Household |
| Immigrants | Trinidad and Tobago | 0.0 /100 | #333 | Tragic 24.6% |
| Immigrants | Bangladesh | 0.0 /100 | #334 | Tragic 25.8% |
| Barbadians | 0.0 /100 | #335 | Tragic 26.1% |
| Vietnamese | 0.0 /100 | #336 | Tragic 26.2% |
| Immigrants | Uzbekistan | 0.0 /100 | #337 | Tragic 26.7% |
| Guyanese | 0.0 /100 | #338 | Tragic 29.3% |
| Dominicans | 0.0 /100 | #339 | Tragic 29.4% |
| Immigrants | Barbados | 0.0 /100 | #340 | Tragic 29.5% |
| Immigrants | Guyana | 0.0 /100 | #341 | Tragic 29.5% |
| British West Indians | 0.0 /100 | #342 | Tragic 29.7% |
| Inupiat | 0.0 /100 | #343 | Tragic 29.9% |
| Immigrants | Dominican Republic | 0.0 /100 | #344 | Tragic 31.4% |
| Immigrants | St. Vincent and the Grenadines | 0.0 /100 | #345 | Tragic 35.4% |
| Immigrants | Grenada | 0.0 /100 | #346 | Tragic 37.5% |
| Yup'ik | 0.0 /100 | #347 | Tragic 45.9% |