Argentinean vs Soviet Union 3 or more Vehicles in Household
COMPARE
Argentinean
Soviet Union
3 or more Vehicles in Household
3 or more Vehicles in Household Comparison
Argentineans
Soviet Union
18.9%
3 OR MORE VEHICLES IN HOUSEHOLD
18.2/ 100
METRIC RATING
200th/ 347
METRIC RANK
14.2%
3 OR MORE VEHICLES IN HOUSEHOLD
0.0/ 100
METRIC RATING
326th/ 347
METRIC RANK
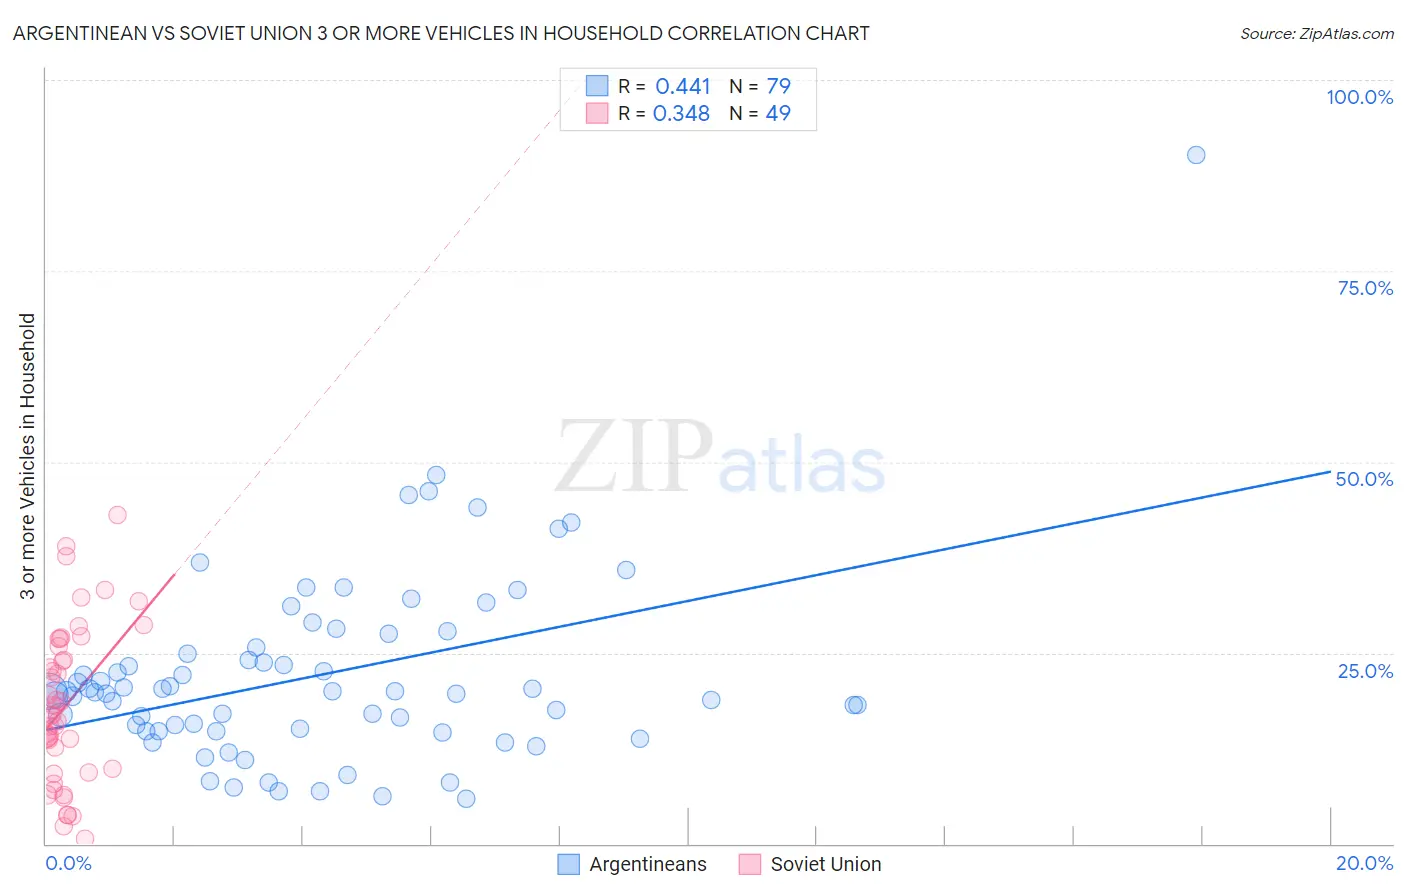
Argentinean vs Soviet Union 3 or more Vehicles in Household Correlation Chart
The statistical analysis conducted on geographies consisting of 296,926,248 people shows a moderate positive correlation between the proportion of Argentineans and percentage of households with 3 or more vehicles available in the United States with a correlation coefficient (R) of 0.441 and weighted average of 18.9%. Similarly, the statistical analysis conducted on geographies consisting of 43,505,589 people shows a mild positive correlation between the proportion of Soviet Union and percentage of households with 3 or more vehicles available in the United States with a correlation coefficient (R) of 0.348 and weighted average of 14.2%, a difference of 33.6%.
3 or more Vehicles in Household Correlation Summary
| Measurement | Argentinean | Soviet Union |
| Minimum | 6.0% | 0.69% |
| Maximum | 90.2% | 43.0% |
| Range | 84.2% | 42.4% |
| Mean | 22.1% | 18.2% |
| Median | 19.9% | 16.9% |
| Interquartile 25% (IQ1) | 14.8% | 9.5% |
| Interquartile 75% (IQ3) | 25.6% | 26.4% |
| Interquartile Range (IQR) | 10.8% | 16.8% |
| Standard Deviation (Sample) | 12.5% | 10.2% |
| Standard Deviation (Population) | 12.4% | 10.1% |
Similar Demographics by 3 or more Vehicles in Household
Demographics Similar to Argentineans by 3 or more Vehicles in Household
In terms of 3 or more vehicles in household, the demographic groups most similar to Argentineans are Arab (18.9%, a difference of 0.060%), Immigrants from Norway (19.0%, a difference of 0.10%), Egyptian (19.0%, a difference of 0.17%), Immigrants from Austria (18.9%, a difference of 0.39%), and Immigrants from Japan (19.0%, a difference of 0.46%).
| Demographics | Rating | Rank | 3 or more Vehicles in Household |
| Tsimshian | 24.4 /100 | #193 | Fair 19.1% |
| Serbians | 24.0 /100 | #194 | Fair 19.1% |
| Immigrants | Moldova | 23.6 /100 | #195 | Fair 19.1% |
| Central American Indians | 22.2 /100 | #196 | Fair 19.0% |
| Immigrants | Japan | 22.0 /100 | #197 | Fair 19.0% |
| Egyptians | 19.5 /100 | #198 | Poor 19.0% |
| Immigrants | Norway | 19.0 /100 | #199 | Poor 19.0% |
| Argentineans | 18.2 /100 | #200 | Poor 18.9% |
| Arabs | 17.7 /100 | #201 | Poor 18.9% |
| Immigrants | Austria | 15.4 /100 | #202 | Poor 18.9% |
| Tohono O'odham | 14.8 /100 | #203 | Poor 18.9% |
| Immigrants | Romania | 14.6 /100 | #204 | Poor 18.9% |
| Russians | 14.2 /100 | #205 | Poor 18.8% |
| Immigrants | Eastern Asia | 14.1 /100 | #206 | Poor 18.8% |
| Immigrants | Chile | 13.6 /100 | #207 | Poor 18.8% |
Demographics Similar to Soviet Union by 3 or more Vehicles in Household
In terms of 3 or more vehicles in household, the demographic groups most similar to Soviet Union are Senegalese (14.2%, a difference of 0.33%), Immigrants from Yemen (14.2%, a difference of 0.41%), Ecuadorian (14.1%, a difference of 0.89%), Immigrants from Albania (14.0%, a difference of 1.6%), and Immigrants from Caribbean (14.6%, a difference of 2.7%).
| Demographics | Rating | Rank | 3 or more Vehicles in Household |
| Cape Verdeans | 0.0 /100 | #319 | Tragic 15.0% |
| Yup'ik | 0.0 /100 | #320 | Tragic 14.8% |
| Immigrants | Jamaica | 0.0 /100 | #321 | Tragic 14.7% |
| Immigrants | West Indies | 0.0 /100 | #322 | Tragic 14.6% |
| Immigrants | Caribbean | 0.0 /100 | #323 | Tragic 14.6% |
| Immigrants | Yemen | 0.0 /100 | #324 | Tragic 14.2% |
| Senegalese | 0.0 /100 | #325 | Tragic 14.2% |
| Soviet Union | 0.0 /100 | #326 | Tragic 14.2% |
| Ecuadorians | 0.0 /100 | #327 | Tragic 14.1% |
| Immigrants | Albania | 0.0 /100 | #328 | Tragic 14.0% |
| Immigrants | Senegal | 0.0 /100 | #329 | Tragic 13.8% |
| West Indians | 0.0 /100 | #330 | Tragic 13.7% |
| Immigrants | Dominica | 0.0 /100 | #331 | Tragic 13.7% |
| Trinidadians and Tobagonians | 0.0 /100 | #332 | Tragic 13.6% |
| Immigrants | Cabo Verde | 0.0 /100 | #333 | Tragic 13.6% |