Zip Codes with the Highest Percentage of Population Employed in Farming, Fishing & Forestry in Cedar City, UT
RELATED REPORTS & OPTIONS
Farming, Fishing & Forestry
Cedar City
Compare Zip Codes
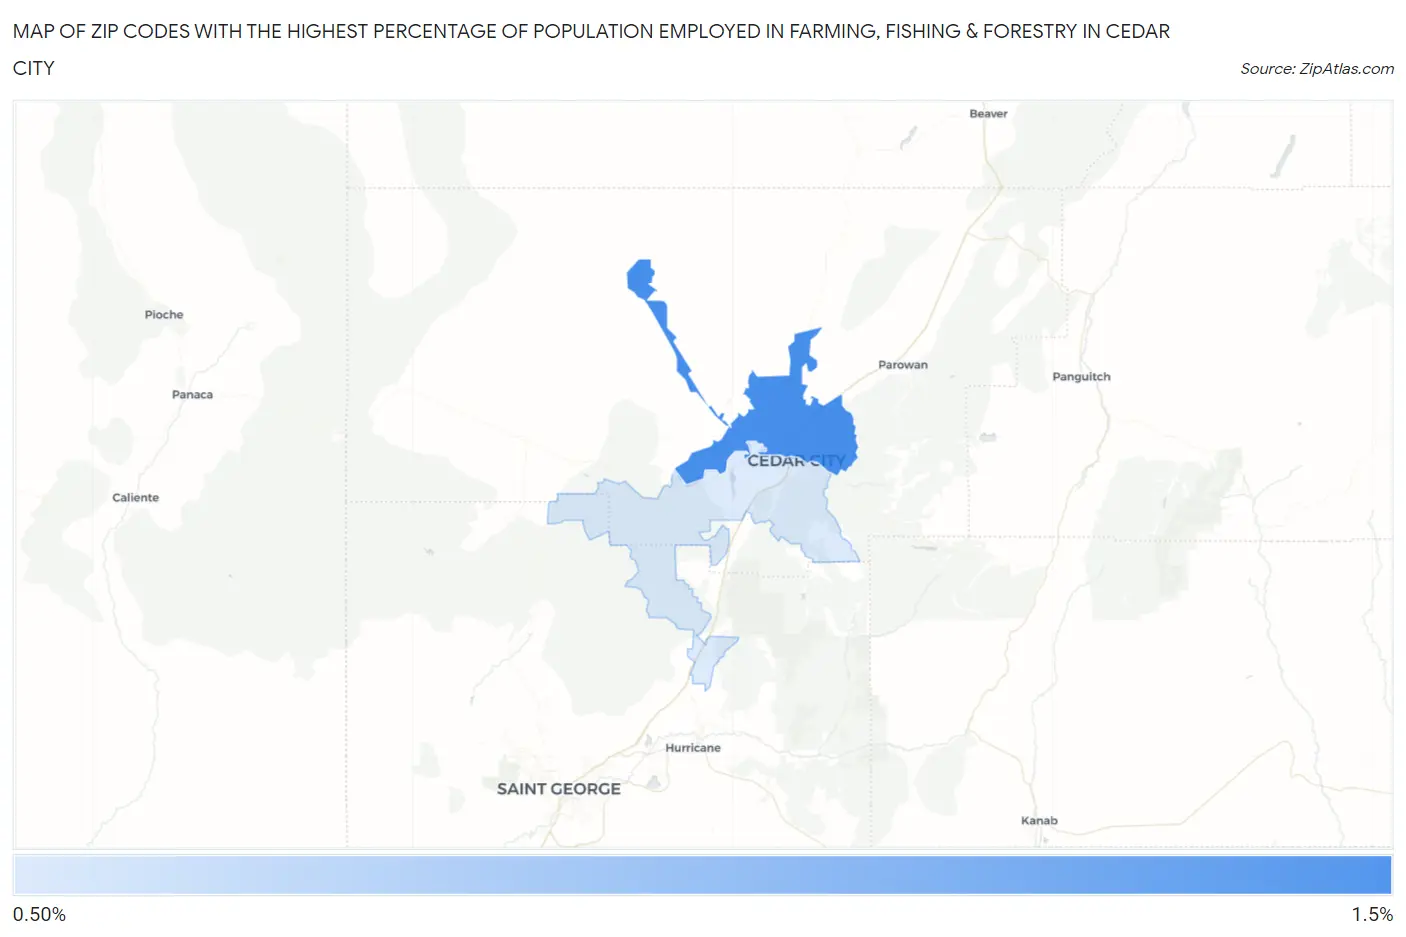
Map of Zip Codes with the Highest Percentage of Population Employed in Farming, Fishing & Forestry in Cedar City
0.90%
1.2%
Zip Codes with the Highest Percentage of Population Employed in Farming, Fishing & Forestry in Cedar City, UT
| Zip Code | % Employed | vs State | vs National | |
| 1. | 84721 | 1.2% | 0.32%(+0.917)#72 | 0.61%(+0.634)#8,798 |
| 2. | 84720 | 0.90% | 0.32%(+0.577)#83 | 0.61%(+0.294)#10,237 |
1
Common Questions
What are the Top Zip Codes with the Highest Percentage of Population Employed in Farming, Fishing & Forestry in Cedar City, UT?
Top Zip Codes with the Highest Percentage of Population Employed in Farming, Fishing & Forestry in Cedar City, UT are:
What zip code has the Highest Percentage of Population Employed in Farming, Fishing & Forestry in Cedar City, UT?
84721 has the Highest Percentage of Population Employed in Farming, Fishing & Forestry in Cedar City, UT with 1.2%.
What is the Percentage of Population Employed in Farming, Fishing & Forestry in Cedar City, UT?
Percentage of Population Employed in Farming, Fishing & Forestry in Cedar City is 0.73%.
What is the Percentage of Population Employed in Farming, Fishing & Forestry in Utah?
Percentage of Population Employed in Farming, Fishing & Forestry in Utah is 0.32%.
What is the Percentage of Population Employed in Farming, Fishing & Forestry in the United States?
Percentage of Population Employed in Farming, Fishing & Forestry in the United States is 0.61%.