Zip Codes with the Highest Percentage of Black / African American Population in Orange, TX
RELATED REPORTS & OPTIONS
Black / African American
Orange
Compare Zip Codes
Map of Zip Codes with the Highest Percentage of Black / African American Population in Orange
3.2%
22.4%
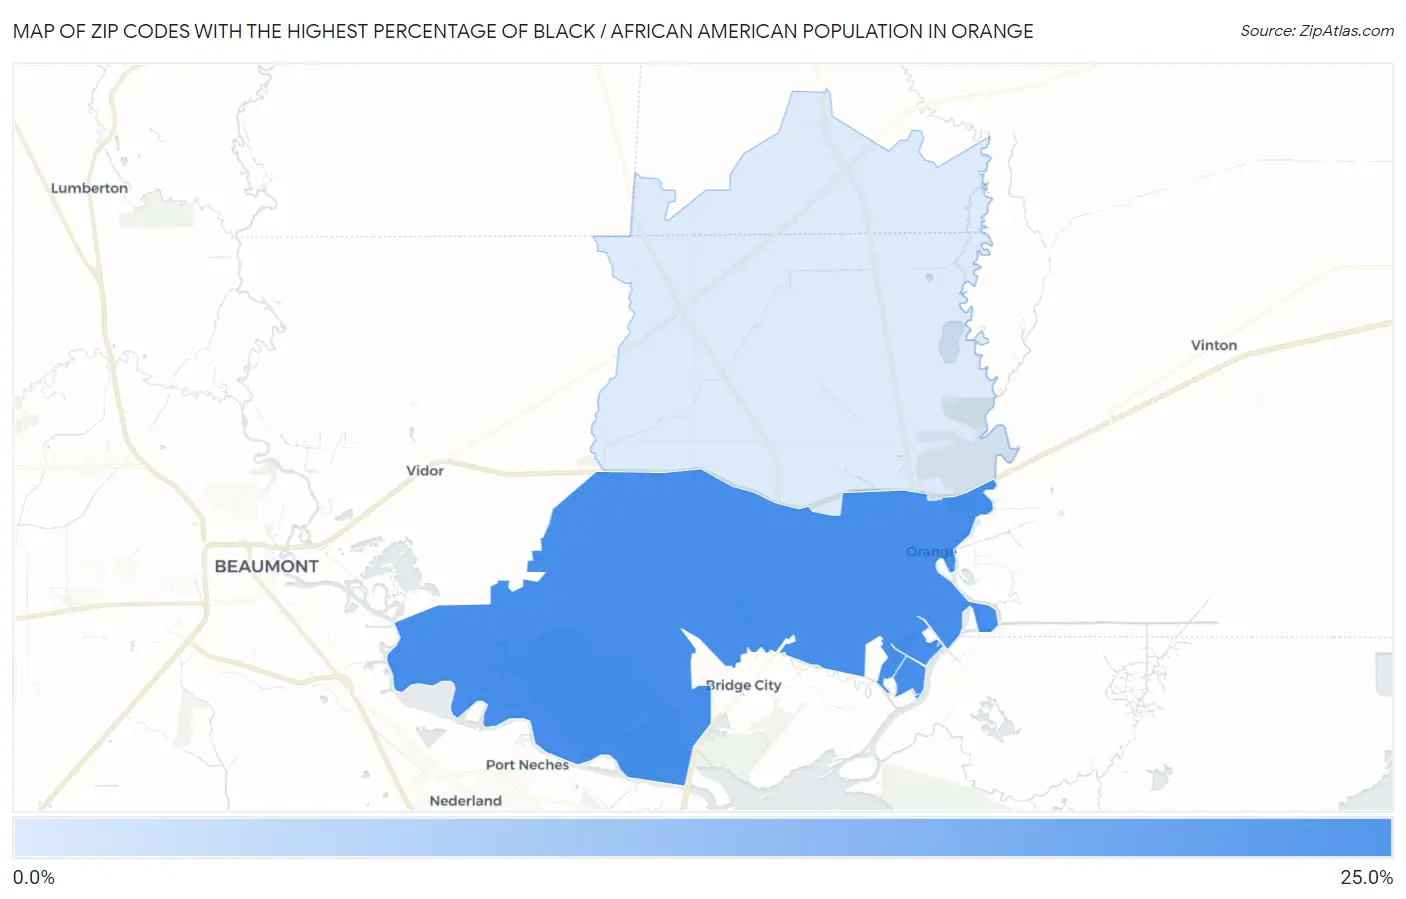
Zip Codes with the Highest Percentage of Black / African American Population in Orange, TX
| Zip Code | Black / African American | vs State | vs National | |
| 1. | 77630 | 22.4% | 12.1%(+10.2)#202 | 12.5%(+9.88)#3,581 |
| 2. | 77632 | 3.2% | 12.1%(-8.90)#1,008 | 12.5%(-9.22)#11,420 |
1
Common Questions
What are the Top Zip Codes with the Highest Percentage of Black / African American Population in Orange, TX?
Top Zip Codes with the Highest Percentage of Black / African American Population in Orange, TX are:
What zip code has the Highest Percentage of Black / African American Population in Orange, TX?
77630 has the Highest Percentage of Black / African American Population in Orange, TX with 22.4%.
What is the Percentage of Black / African American Population in Orange, TX?
Percentage of Black / African American Population in Orange is 31.5%.
What is the Percentage of Black / African American Population in Texas?
Percentage of Black / African American Population in Texas is 12.1%.
What is the Percentage of Black / African American Population in the United States?
Percentage of Black / African American Population in the United States is 12.5%.