Zip Codes with the Highest Percentage of Black / African American Population in Waxahachie, TX
RELATED REPORTS & OPTIONS
Black / African American
Waxahachie
Compare Zip Codes
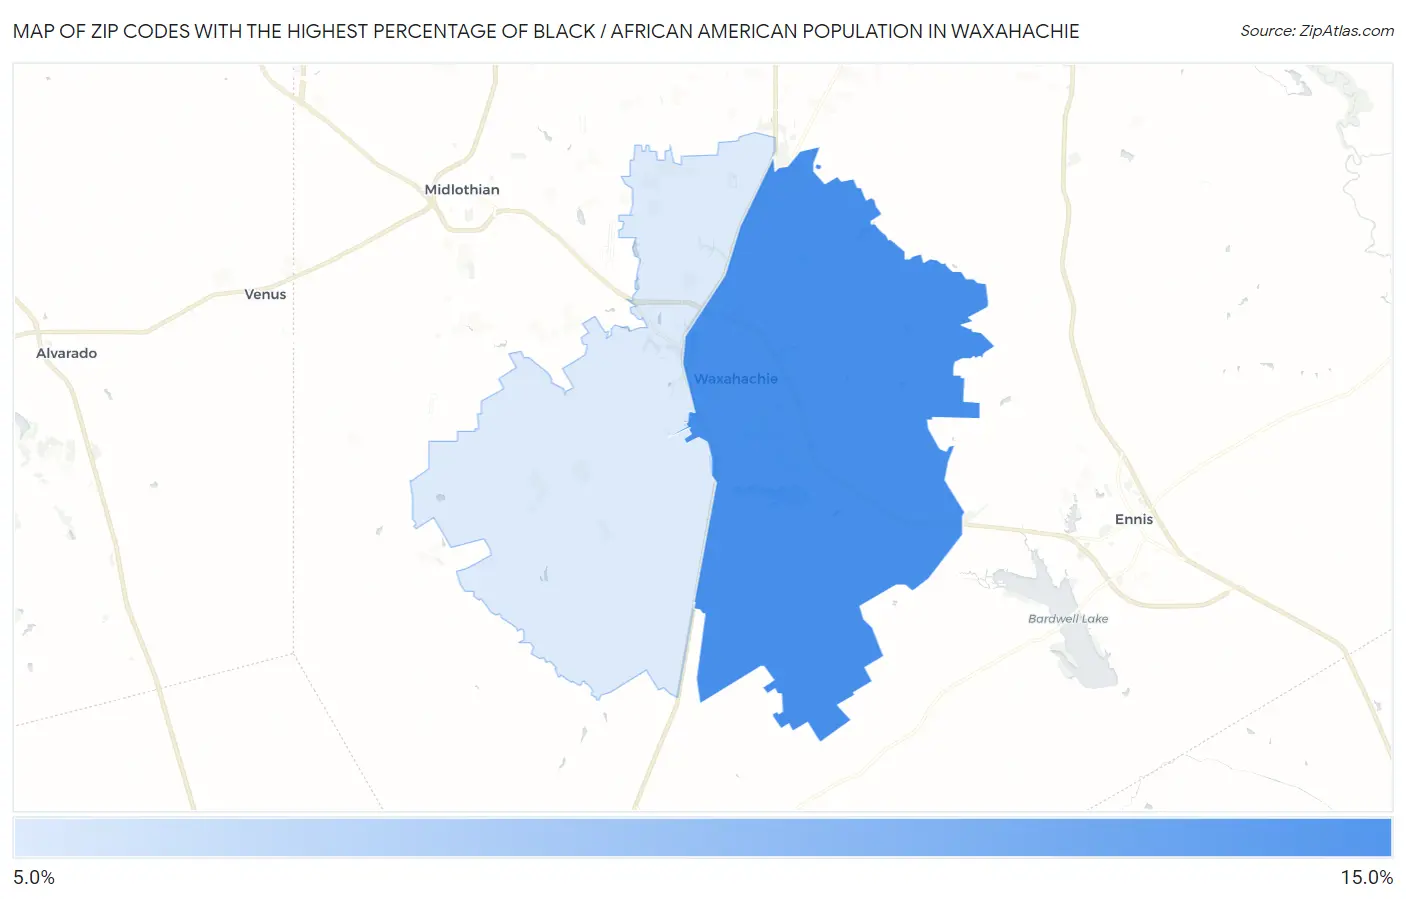
Map of Zip Codes with the Highest Percentage of Black / African American Population in Waxahachie
8.9%
14.7%
Zip Codes with the Highest Percentage of Black / African American Population in Waxahachie, TX
| Zip Code | Black / African American | vs State | vs National | |
| 1. | 75165 | 14.7% | 12.1%(+2.56)#357 | 12.5%(+2.24)#5,030 |
| 2. | 75167 | 8.9% | 12.1%(-3.24)#622 | 12.5%(-3.56)#7,074 |
1
Common Questions
What are the Top Zip Codes with the Highest Percentage of Black / African American Population in Waxahachie, TX?
Top Zip Codes with the Highest Percentage of Black / African American Population in Waxahachie, TX are:
What zip code has the Highest Percentage of Black / African American Population in Waxahachie, TX?
75165 has the Highest Percentage of Black / African American Population in Waxahachie, TX with 14.7%.
What is the Percentage of Black / African American Population in Waxahachie, TX?
Percentage of Black / African American Population in Waxahachie is 17.0%.
What is the Percentage of Black / African American Population in Texas?
Percentage of Black / African American Population in Texas is 12.1%.
What is the Percentage of Black / African American Population in the United States?
Percentage of Black / African American Population in the United States is 12.5%.