Zip Codes with the Highest Percentage of Population Employed in Sales & Related in Cookeville, TN
RELATED REPORTS & OPTIONS
Sales & Related
Cookeville
Compare Zip Codes
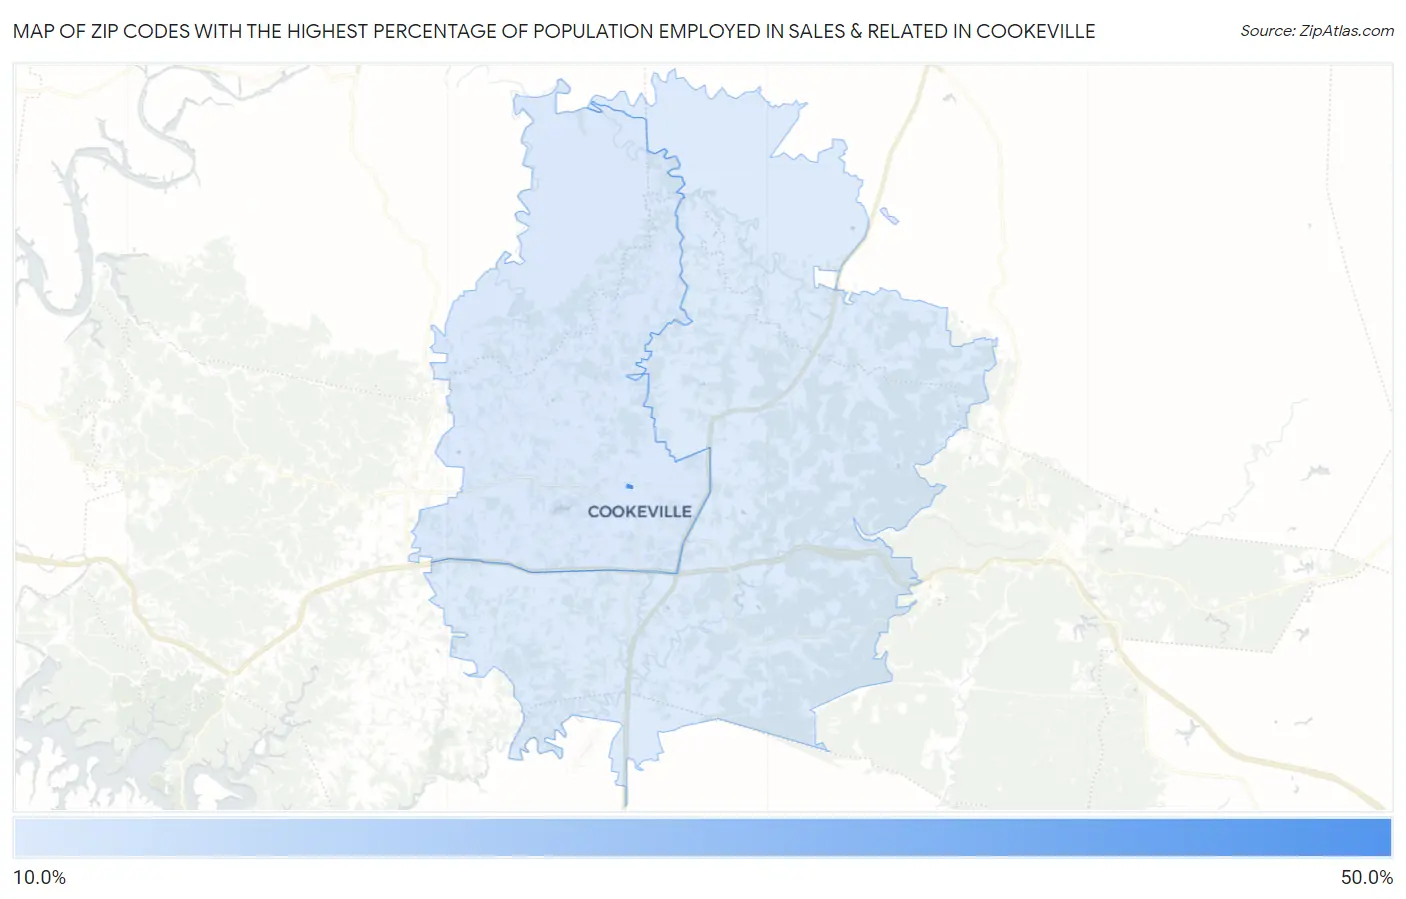
Map of Zip Codes with the Highest Percentage of Population Employed in Sales & Related in Cookeville
10.7%
42.0%
Zip Codes with the Highest Percentage of Population Employed in Sales & Related in Cookeville, TN
| Zip Code | % Employed | vs State | vs National | |
| 1. | 38505 | 42.0% | 9.8%(+32.2)#1 | 9.6%(+32.4)#184 |
| 2. | 38501 | 11.2% | 9.8%(+1.37)#149 | 9.6%(+1.60)#7,697 |
| 3. | 38506 | 10.7% | 9.8%(+0.831)#182 | 9.6%(+1.07)#9,093 |
1
Common Questions
What are the Top Zip Codes with the Highest Percentage of Population Employed in Sales & Related in Cookeville, TN?
Top Zip Codes with the Highest Percentage of Population Employed in Sales & Related in Cookeville, TN are:
What zip code has the Highest Percentage of Population Employed in Sales & Related in Cookeville, TN?
38505 has the Highest Percentage of Population Employed in Sales & Related in Cookeville, TN with 42.0%.
What is the Percentage of Population Employed in Sales & Related in Cookeville, TN?
Percentage of Population Employed in Sales & Related in Cookeville is 12.5%.
What is the Percentage of Population Employed in Sales & Related in Tennessee?
Percentage of Population Employed in Sales & Related in Tennessee is 9.8%.
What is the Percentage of Population Employed in Sales & Related in the United States?
Percentage of Population Employed in Sales & Related in the United States is 9.6%.