Yup'ik vs Guamanian/Chamorro Single Female Poverty
COMPARE
Yup'ik
Guamanian/Chamorro
Single Female Poverty
Single Female Poverty Comparison
Yup'ik
Guamanians/Chamorros
26.6%
SINGLE FEMALE POVERTY
0.0/ 100
METRIC RATING
321st/ 347
METRIC RANK
21.6%
SINGLE FEMALE POVERTY
13.7/ 100
METRIC RATING
213th/ 347
METRIC RANK
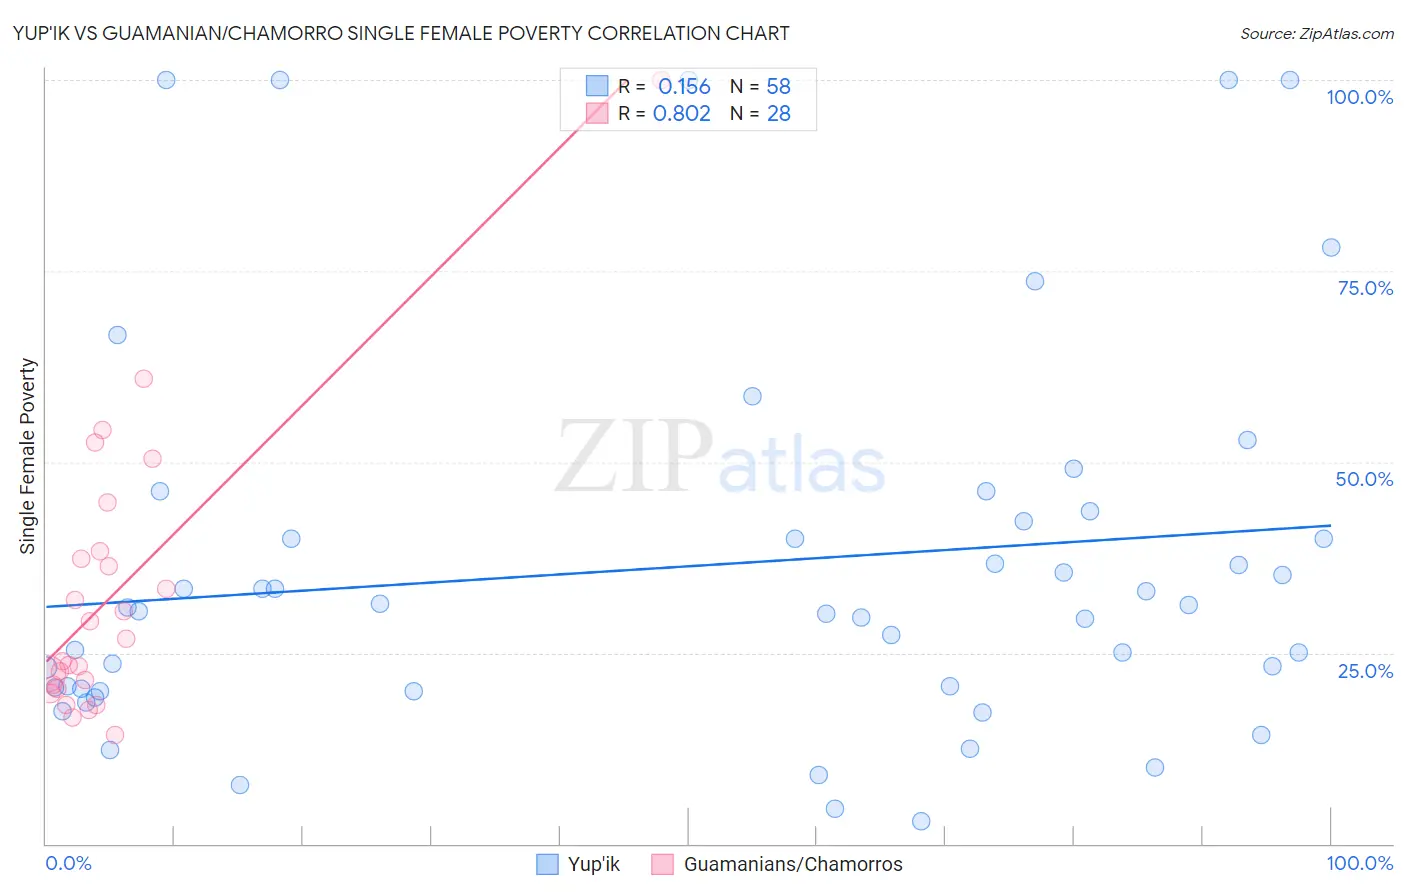
Yup'ik vs Guamanian/Chamorro Single Female Poverty Correlation Chart
The statistical analysis conducted on geographies consisting of 39,804,505 people shows a poor positive correlation between the proportion of Yup'ik and poverty level among single females in the United States with a correlation coefficient (R) of 0.156 and weighted average of 26.6%. Similarly, the statistical analysis conducted on geographies consisting of 220,498,532 people shows a very strong positive correlation between the proportion of Guamanians/Chamorros and poverty level among single females in the United States with a correlation coefficient (R) of 0.802 and weighted average of 21.6%, a difference of 23.1%.
Single Female Poverty Correlation Summary
| Measurement | Yup'ik | Guamanian/Chamorro |
| Minimum | 2.9% | 14.3% |
| Maximum | 100.0% | 100.0% |
| Range | 97.1% | 85.7% |
| Mean | 36.3% | 32.5% |
| Median | 30.7% | 25.4% |
| Interquartile 25% (IQ1) | 20.3% | 20.5% |
| Interquartile 75% (IQ3) | 42.3% | 37.8% |
| Interquartile Range (IQR) | 22.0% | 17.3% |
| Standard Deviation (Sample) | 25.0% | 18.3% |
| Standard Deviation (Population) | 24.8% | 18.0% |
Similar Demographics by Single Female Poverty
Demographics Similar to Yup'ik by Single Female Poverty
In terms of single female poverty, the demographic groups most similar to Yup'ik are Arapaho (26.4%, a difference of 0.64%), Seminole (26.8%, a difference of 0.74%), Chippewa (26.8%, a difference of 0.84%), Black/African American (26.4%, a difference of 0.95%), and Kiowa (26.9%, a difference of 1.3%).
| Demographics | Rating | Rank | Single Female Poverty |
| Cherokee | 0.0 /100 | #314 | Tragic 25.7% |
| Iroquois | 0.0 /100 | #315 | Tragic 25.7% |
| Immigrants | Somalia | 0.0 /100 | #316 | Tragic 25.8% |
| Ottawa | 0.0 /100 | #317 | Tragic 26.0% |
| Chickasaw | 0.0 /100 | #318 | Tragic 26.3% |
| Blacks/African Americans | 0.0 /100 | #319 | Tragic 26.4% |
| Arapaho | 0.0 /100 | #320 | Tragic 26.4% |
| Yup'ik | 0.0 /100 | #321 | Tragic 26.6% |
| Seminole | 0.0 /100 | #322 | Tragic 26.8% |
| Chippewa | 0.0 /100 | #323 | Tragic 26.8% |
| Kiowa | 0.0 /100 | #324 | Tragic 26.9% |
| Choctaw | 0.0 /100 | #325 | Tragic 27.2% |
| Creek | 0.0 /100 | #326 | Tragic 27.4% |
| Dutch West Indians | 0.0 /100 | #327 | Tragic 27.5% |
| Apache | 0.0 /100 | #328 | Tragic 27.7% |
Demographics Similar to Guamanians/Chamorros by Single Female Poverty
In terms of single female poverty, the demographic groups most similar to Guamanians/Chamorros are Jamaican (21.6%, a difference of 0.030%), Icelander (21.6%, a difference of 0.040%), Immigrants from Nicaragua (21.6%, a difference of 0.060%), Immigrants from Panama (21.6%, a difference of 0.080%), and Immigrants from Eastern Africa (21.6%, a difference of 0.17%).
| Demographics | Rating | Rank | Single Female Poverty |
| Belgians | 16.1 /100 | #206 | Poor 21.5% |
| Ghanaians | 15.7 /100 | #207 | Poor 21.6% |
| Haitians | 15.4 /100 | #208 | Poor 21.6% |
| Immigrants | Eastern Africa | 15.1 /100 | #209 | Poor 21.6% |
| Immigrants | Panama | 14.4 /100 | #210 | Poor 21.6% |
| Icelanders | 14.0 /100 | #211 | Poor 21.6% |
| Jamaicans | 14.0 /100 | #212 | Poor 21.6% |
| Guamanians/Chamorros | 13.7 /100 | #213 | Poor 21.6% |
| Immigrants | Nicaragua | 13.3 /100 | #214 | Poor 21.6% |
| Ecuadorians | 12.3 /100 | #215 | Poor 21.6% |
| Immigrants | Barbados | 12.2 /100 | #216 | Poor 21.7% |
| Immigrants | St. Vincent and the Grenadines | 11.7 /100 | #217 | Poor 21.7% |
| Nepalese | 9.7 /100 | #218 | Tragic 21.7% |
| Panamanians | 9.4 /100 | #219 | Tragic 21.7% |
| Germans | 8.3 /100 | #220 | Tragic 21.8% |