Immigrants from St. Vincent and the Grenadines vs Guamanian/Chamorro Single Female Poverty
COMPARE
Immigrants from St. Vincent and the Grenadines
Guamanian/Chamorro
Single Female Poverty
Single Female Poverty Comparison
Immigrants from St. Vincent and the Grenadines
Guamanians/Chamorros
21.7%
SINGLE FEMALE POVERTY
11.7/ 100
METRIC RATING
217th/ 347
METRIC RANK
21.6%
SINGLE FEMALE POVERTY
13.7/ 100
METRIC RATING
213th/ 347
METRIC RANK
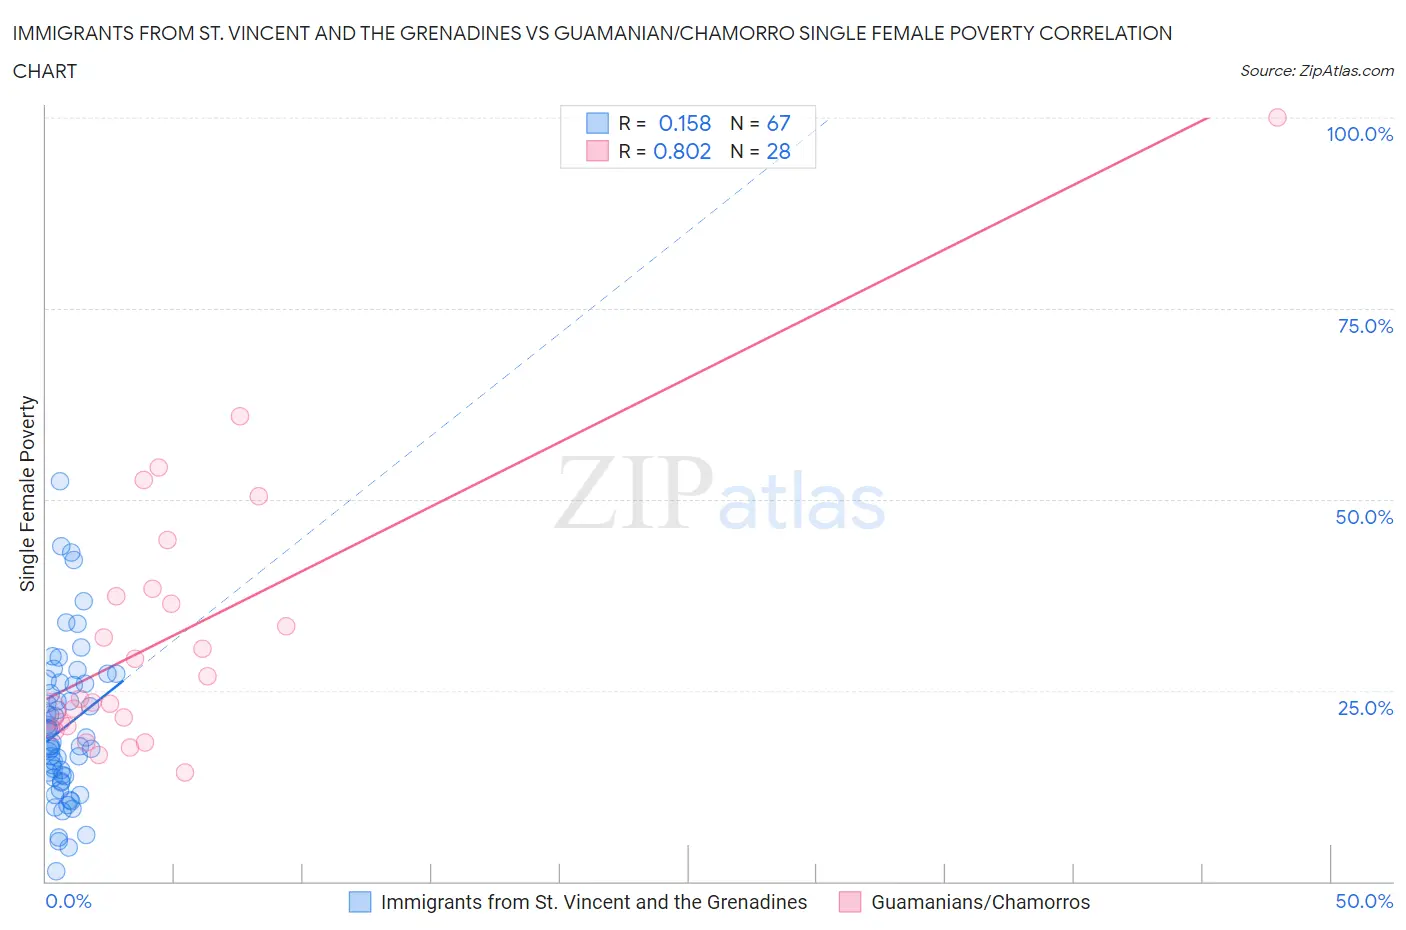
Immigrants from St. Vincent and the Grenadines vs Guamanian/Chamorro Single Female Poverty Correlation Chart
The statistical analysis conducted on geographies consisting of 56,125,739 people shows a poor positive correlation between the proportion of Immigrants from St. Vincent and the Grenadines and poverty level among single females in the United States with a correlation coefficient (R) of 0.158 and weighted average of 21.7%. Similarly, the statistical analysis conducted on geographies consisting of 220,498,532 people shows a very strong positive correlation between the proportion of Guamanians/Chamorros and poverty level among single females in the United States with a correlation coefficient (R) of 0.802 and weighted average of 21.6%, a difference of 0.28%.
Single Female Poverty Correlation Summary
| Measurement | Immigrants from St. Vincent and the Grenadines | Guamanian/Chamorro |
| Minimum | 1.3% | 14.3% |
| Maximum | 52.4% | 100.0% |
| Range | 51.1% | 85.7% |
| Mean | 20.1% | 32.5% |
| Median | 18.1% | 25.4% |
| Interquartile 25% (IQ1) | 13.5% | 20.5% |
| Interquartile 75% (IQ3) | 25.9% | 37.8% |
| Interquartile Range (IQR) | 12.3% | 17.3% |
| Standard Deviation (Sample) | 9.9% | 18.3% |
| Standard Deviation (Population) | 9.8% | 18.0% |
Demographics Similar to Immigrants from St. Vincent and the Grenadines and Guamanians/Chamorros by Single Female Poverty
In terms of single female poverty, the demographic groups most similar to Immigrants from St. Vincent and the Grenadines are Immigrants from Barbados (21.7%, a difference of 0.060%), Ecuadorian (21.6%, a difference of 0.090%), Immigrants from Nicaragua (21.6%, a difference of 0.22%), Jamaican (21.6%, a difference of 0.30%), and Icelander (21.6%, a difference of 0.31%). Similarly, the demographic groups most similar to Guamanians/Chamorros are Jamaican (21.6%, a difference of 0.030%), Icelander (21.6%, a difference of 0.040%), Immigrants from Nicaragua (21.6%, a difference of 0.060%), Immigrants from Panama (21.6%, a difference of 0.080%), and Immigrants from Eastern Africa (21.6%, a difference of 0.17%).
| Demographics | Rating | Rank | Single Female Poverty |
| Finns | 16.2 /100 | #205 | Poor 21.5% |
| Belgians | 16.1 /100 | #206 | Poor 21.5% |
| Ghanaians | 15.7 /100 | #207 | Poor 21.6% |
| Haitians | 15.4 /100 | #208 | Poor 21.6% |
| Immigrants | Eastern Africa | 15.1 /100 | #209 | Poor 21.6% |
| Immigrants | Panama | 14.4 /100 | #210 | Poor 21.6% |
| Icelanders | 14.0 /100 | #211 | Poor 21.6% |
| Jamaicans | 14.0 /100 | #212 | Poor 21.6% |
| Guamanians/Chamorros | 13.7 /100 | #213 | Poor 21.6% |
| Immigrants | Nicaragua | 13.3 /100 | #214 | Poor 21.6% |
| Ecuadorians | 12.3 /100 | #215 | Poor 21.6% |
| Immigrants | Barbados | 12.2 /100 | #216 | Poor 21.7% |
| Immigrants | St. Vincent and the Grenadines | 11.7 /100 | #217 | Poor 21.7% |
| Nepalese | 9.7 /100 | #218 | Tragic 21.7% |
| Panamanians | 9.4 /100 | #219 | Tragic 21.7% |
| Germans | 8.3 /100 | #220 | Tragic 21.8% |
| Immigrants | Grenada | 8.0 /100 | #221 | Tragic 21.8% |
| Immigrants | Eritrea | 7.9 /100 | #222 | Tragic 21.8% |
| Scottish | 7.3 /100 | #223 | Tragic 21.8% |
| Barbadians | 7.2 /100 | #224 | Tragic 21.8% |
| English | 6.4 /100 | #225 | Tragic 21.9% |