Yup'ik vs Immigrants from Croatia Single Female Poverty
COMPARE
Yup'ik
Immigrants from Croatia
Single Female Poverty
Single Female Poverty Comparison
Yup'ik
Immigrants from Croatia
26.6%
SINGLE FEMALE POVERTY
0.0/ 100
METRIC RATING
321st/ 347
METRIC RANK
18.9%
SINGLE FEMALE POVERTY
99.9/ 100
METRIC RATING
44th/ 347
METRIC RANK
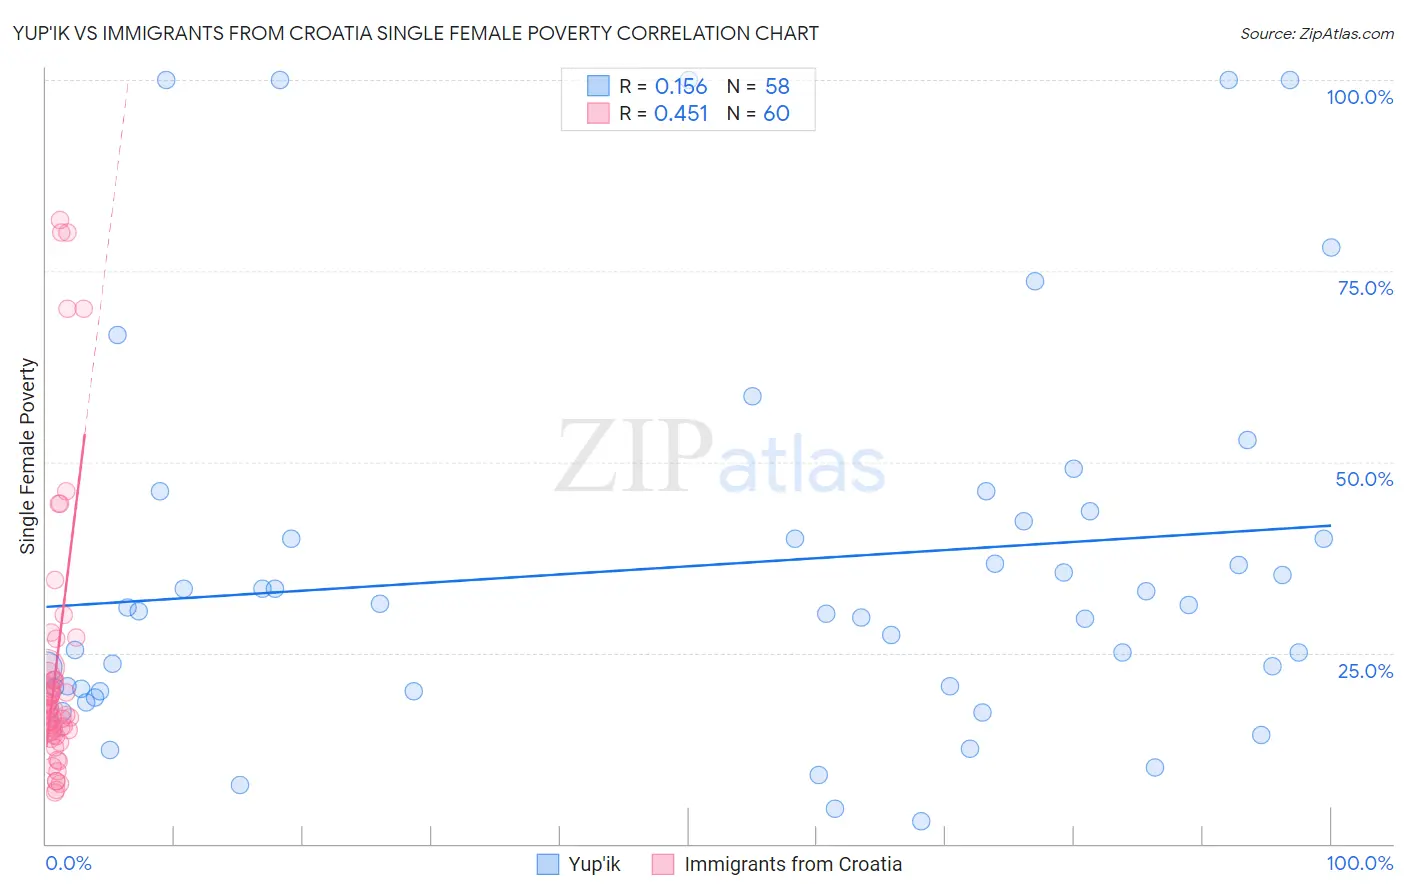
Yup'ik vs Immigrants from Croatia Single Female Poverty Correlation Chart
The statistical analysis conducted on geographies consisting of 39,804,505 people shows a poor positive correlation between the proportion of Yup'ik and poverty level among single females in the United States with a correlation coefficient (R) of 0.156 and weighted average of 26.6%. Similarly, the statistical analysis conducted on geographies consisting of 131,494,560 people shows a moderate positive correlation between the proportion of Immigrants from Croatia and poverty level among single females in the United States with a correlation coefficient (R) of 0.451 and weighted average of 18.9%, a difference of 40.9%.
Single Female Poverty Correlation Summary
| Measurement | Yup'ik | Immigrants from Croatia |
| Minimum | 2.9% | 6.7% |
| Maximum | 100.0% | 81.7% |
| Range | 97.1% | 74.9% |
| Mean | 36.3% | 23.4% |
| Median | 30.7% | 17.6% |
| Interquartile 25% (IQ1) | 20.3% | 14.7% |
| Interquartile 75% (IQ3) | 42.3% | 21.8% |
| Interquartile Range (IQR) | 22.0% | 7.1% |
| Standard Deviation (Sample) | 25.0% | 18.1% |
| Standard Deviation (Population) | 24.8% | 18.0% |
Similar Demographics by Single Female Poverty
Demographics Similar to Yup'ik by Single Female Poverty
In terms of single female poverty, the demographic groups most similar to Yup'ik are Arapaho (26.4%, a difference of 0.64%), Seminole (26.8%, a difference of 0.74%), Chippewa (26.8%, a difference of 0.84%), Black/African American (26.4%, a difference of 0.95%), and Kiowa (26.9%, a difference of 1.3%).
| Demographics | Rating | Rank | Single Female Poverty |
| Cherokee | 0.0 /100 | #314 | Tragic 25.7% |
| Iroquois | 0.0 /100 | #315 | Tragic 25.7% |
| Immigrants | Somalia | 0.0 /100 | #316 | Tragic 25.8% |
| Ottawa | 0.0 /100 | #317 | Tragic 26.0% |
| Chickasaw | 0.0 /100 | #318 | Tragic 26.3% |
| Blacks/African Americans | 0.0 /100 | #319 | Tragic 26.4% |
| Arapaho | 0.0 /100 | #320 | Tragic 26.4% |
| Yup'ik | 0.0 /100 | #321 | Tragic 26.6% |
| Seminole | 0.0 /100 | #322 | Tragic 26.8% |
| Chippewa | 0.0 /100 | #323 | Tragic 26.8% |
| Kiowa | 0.0 /100 | #324 | Tragic 26.9% |
| Choctaw | 0.0 /100 | #325 | Tragic 27.2% |
| Creek | 0.0 /100 | #326 | Tragic 27.4% |
| Dutch West Indians | 0.0 /100 | #327 | Tragic 27.5% |
| Apache | 0.0 /100 | #328 | Tragic 27.7% |
Demographics Similar to Immigrants from Croatia by Single Female Poverty
In terms of single female poverty, the demographic groups most similar to Immigrants from Croatia are Immigrants from Romania (18.8%, a difference of 0.17%), Immigrants from Indonesia (18.9%, a difference of 0.21%), Jordanian (18.8%, a difference of 0.32%), Macedonian (18.9%, a difference of 0.38%), and Immigrants from Serbia (18.8%, a difference of 0.40%).
| Demographics | Rating | Rank | Single Female Poverty |
| Immigrants | Armenia | 99.9 /100 | #37 | Exceptional 18.7% |
| Tongans | 99.9 /100 | #38 | Exceptional 18.8% |
| Bulgarians | 99.9 /100 | #39 | Exceptional 18.8% |
| Okinawans | 99.9 /100 | #40 | Exceptional 18.8% |
| Immigrants | Serbia | 99.9 /100 | #41 | Exceptional 18.8% |
| Jordanians | 99.9 /100 | #42 | Exceptional 18.8% |
| Immigrants | Romania | 99.9 /100 | #43 | Exceptional 18.8% |
| Immigrants | Croatia | 99.9 /100 | #44 | Exceptional 18.9% |
| Immigrants | Indonesia | 99.8 /100 | #45 | Exceptional 18.9% |
| Macedonians | 99.8 /100 | #46 | Exceptional 18.9% |
| Latvians | 99.8 /100 | #47 | Exceptional 19.0% |
| Immigrants | Argentina | 99.8 /100 | #48 | Exceptional 19.0% |
| Immigrants | Czechoslovakia | 99.8 /100 | #49 | Exceptional 19.0% |
| Immigrants | Eastern Europe | 99.8 /100 | #50 | Exceptional 19.0% |
| Immigrants | Italy | 99.8 /100 | #51 | Exceptional 19.0% |