Yup'ik vs Guamanian/Chamorro Child Poverty Among Girls Under 16
COMPARE
Yup'ik
Guamanian/Chamorro
Child Poverty Among Girls Under 16
Child Poverty Among Girls Under 16 Comparison
Yup'ik
Guamanians/Chamorros
25.8%
CHILD POVERTY AMONG GIRLS UNDER 16
0.0/ 100
METRIC RATING
337th/ 347
METRIC RANK
15.9%
CHILD POVERTY AMONG GIRLS UNDER 16
75.3/ 100
METRIC RATING
158th/ 347
METRIC RANK
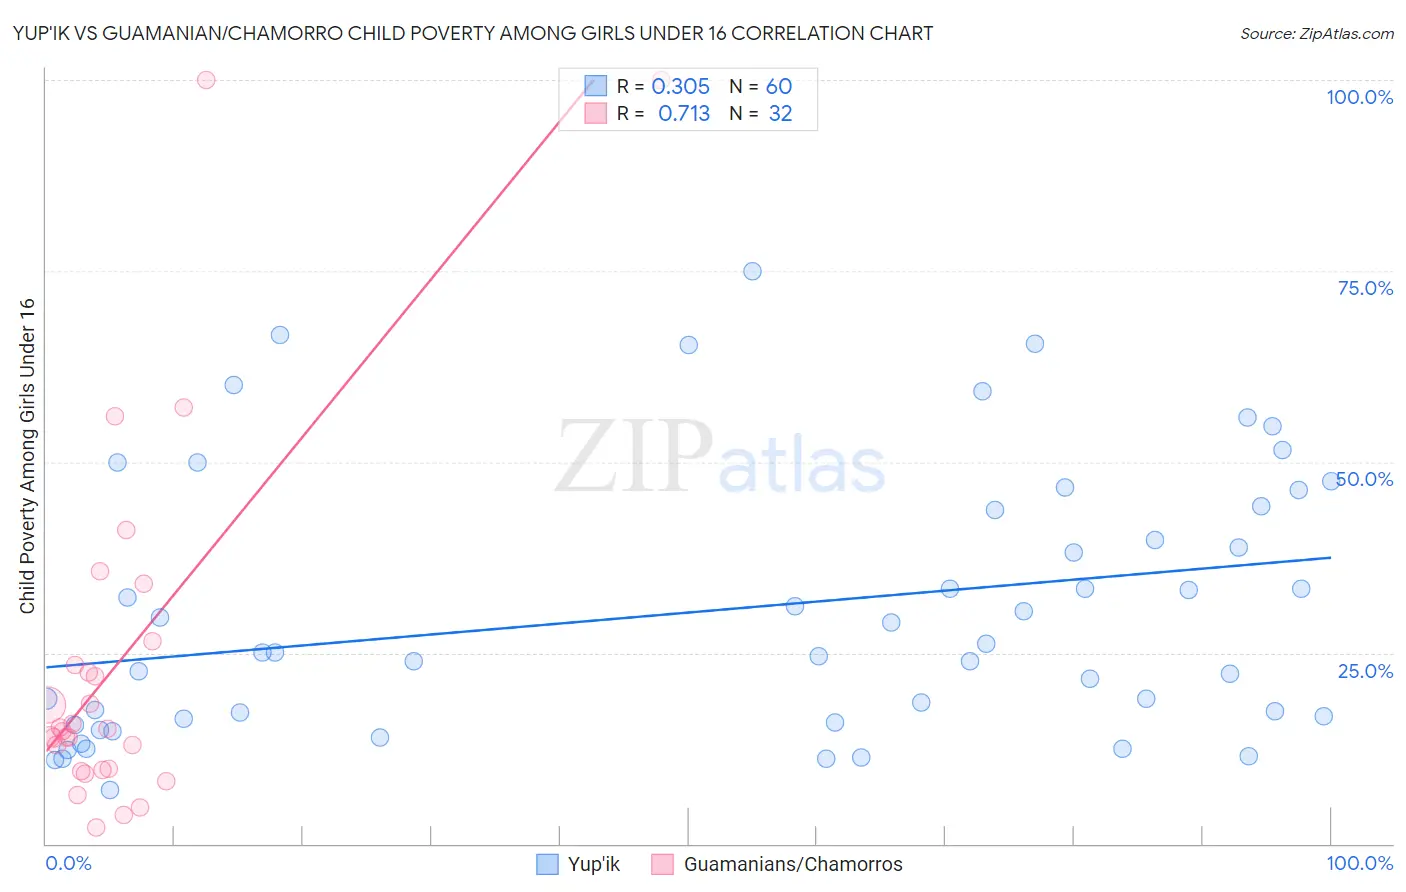
Yup'ik vs Guamanian/Chamorro Child Poverty Among Girls Under 16 Correlation Chart
The statistical analysis conducted on geographies consisting of 39,851,220 people shows a mild positive correlation between the proportion of Yup'ik and poverty level among girls under the age of 16 in the United States with a correlation coefficient (R) of 0.305 and weighted average of 25.8%. Similarly, the statistical analysis conducted on geographies consisting of 220,387,643 people shows a strong positive correlation between the proportion of Guamanians/Chamorros and poverty level among girls under the age of 16 in the United States with a correlation coefficient (R) of 0.713 and weighted average of 15.9%, a difference of 61.9%.
Child Poverty Among Girls Under 16 Correlation Summary
| Measurement | Yup'ik | Guamanian/Chamorro |
| Minimum | 7.1% | 2.0% |
| Maximum | 75.0% | 100.0% |
| Range | 67.9% | 98.0% |
| Mean | 30.5% | 23.8% |
| Median | 25.0% | 14.9% |
| Interquartile 25% (IQ1) | 16.1% | 9.7% |
| Interquartile 75% (IQ3) | 43.9% | 24.9% |
| Interquartile Range (IQR) | 27.8% | 15.2% |
| Standard Deviation (Sample) | 17.4% | 24.0% |
| Standard Deviation (Population) | 17.3% | 23.7% |
Similar Demographics by Child Poverty Among Girls Under 16
Demographics Similar to Yup'ik by Child Poverty Among Girls Under 16
In terms of child poverty among girls under 16, the demographic groups most similar to Yup'ik are Sioux (25.6%, a difference of 0.93%), Cheyenne (26.3%, a difference of 1.8%), Crow (26.4%, a difference of 2.1%), Pueblo (25.2%, a difference of 2.4%), and Menominee (25.0%, a difference of 3.1%).
| Demographics | Rating | Rank | Child Poverty Among Girls Under 16 |
| Immigrants | Dominican Republic | 0.0 /100 | #330 | Tragic 23.8% |
| Apache | 0.0 /100 | #331 | Tragic 23.8% |
| Natives/Alaskans | 0.0 /100 | #332 | Tragic 24.0% |
| Blacks/African Americans | 0.0 /100 | #333 | Tragic 24.7% |
| Menominee | 0.0 /100 | #334 | Tragic 25.0% |
| Pueblo | 0.0 /100 | #335 | Tragic 25.2% |
| Sioux | 0.0 /100 | #336 | Tragic 25.6% |
| Yup'ik | 0.0 /100 | #337 | Tragic 25.8% |
| Cheyenne | 0.0 /100 | #338 | Tragic 26.3% |
| Crow | 0.0 /100 | #339 | Tragic 26.4% |
| Yuman | 0.0 /100 | #340 | Tragic 27.1% |
| Hopi | 0.0 /100 | #341 | Tragic 27.9% |
| Pima | 0.0 /100 | #342 | Tragic 28.2% |
| Immigrants | Yemen | 0.0 /100 | #343 | Tragic 29.5% |
| Navajo | 0.0 /100 | #344 | Tragic 30.5% |
Demographics Similar to Guamanians/Chamorros by Child Poverty Among Girls Under 16
In terms of child poverty among girls under 16, the demographic groups most similar to Guamanians/Chamorros are Slovak (15.9%, a difference of 0.010%), Immigrants from Fiji (15.9%, a difference of 0.12%), Colombian (15.9%, a difference of 0.12%), Syrian (15.9%, a difference of 0.22%), and Immigrants from Chile (15.9%, a difference of 0.23%).
| Demographics | Rating | Rank | Child Poverty Among Girls Under 16 |
| Venezuelans | 80.1 /100 | #151 | Excellent 15.8% |
| Immigrants | Kuwait | 79.4 /100 | #152 | Good 15.8% |
| Immigrants | Nepal | 78.5 /100 | #153 | Good 15.9% |
| Immigrants | Chile | 76.7 /100 | #154 | Good 15.9% |
| Syrians | 76.7 /100 | #155 | Good 15.9% |
| Immigrants | Fiji | 76.1 /100 | #156 | Good 15.9% |
| Colombians | 76.1 /100 | #157 | Good 15.9% |
| Guamanians/Chamorros | 75.3 /100 | #158 | Good 15.9% |
| Slovaks | 75.2 /100 | #159 | Good 15.9% |
| French | 72.8 /100 | #160 | Good 16.0% |
| Immigrants | Northern Africa | 72.0 /100 | #161 | Good 16.0% |
| French Canadians | 68.7 /100 | #162 | Good 16.1% |
| Immigrants | Oceania | 68.4 /100 | #163 | Good 16.1% |
| Immigrants | Colombia | 67.8 /100 | #164 | Good 16.1% |
| Immigrants | Germany | 67.3 /100 | #165 | Good 16.1% |