Yup'ik vs Immigrants from Iraq Single Female Poverty
COMPARE
Yup'ik
Immigrants from Iraq
Single Female Poverty
Single Female Poverty Comparison
Yup'ik
Immigrants from Iraq
26.6%
SINGLE FEMALE POVERTY
0.0/ 100
METRIC RATING
321st/ 347
METRIC RANK
20.2%
SINGLE FEMALE POVERTY
91.2/ 100
METRIC RATING
135th/ 347
METRIC RANK
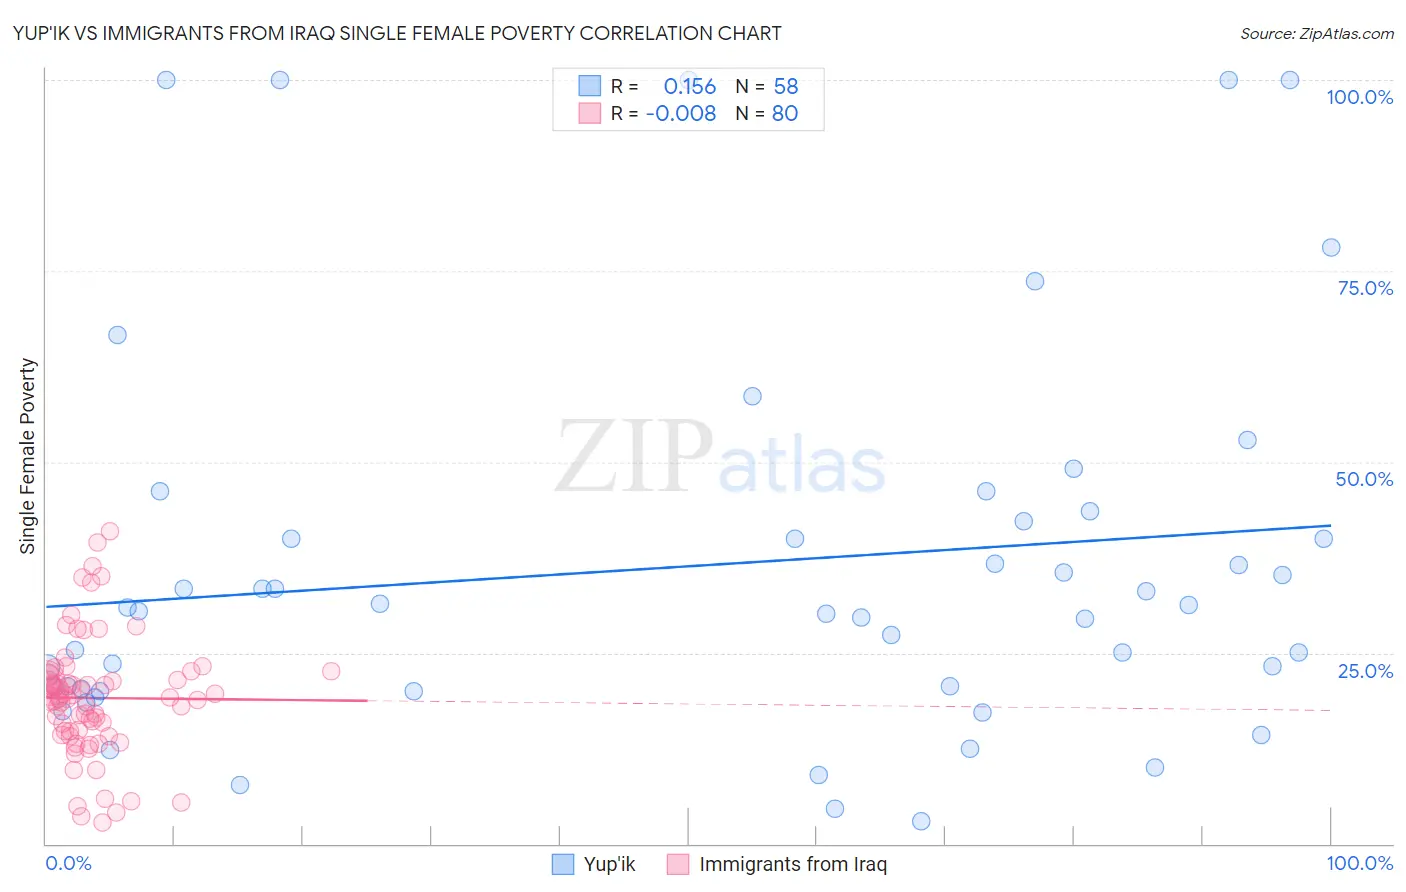
Yup'ik vs Immigrants from Iraq Single Female Poverty Correlation Chart
The statistical analysis conducted on geographies consisting of 39,804,505 people shows a poor positive correlation between the proportion of Yup'ik and poverty level among single females in the United States with a correlation coefficient (R) of 0.156 and weighted average of 26.6%. Similarly, the statistical analysis conducted on geographies consisting of 193,724,992 people shows no correlation between the proportion of Immigrants from Iraq and poverty level among single females in the United States with a correlation coefficient (R) of -0.008 and weighted average of 20.2%, a difference of 31.4%.
Single Female Poverty Correlation Summary
| Measurement | Yup'ik | Immigrants from Iraq |
| Minimum | 2.9% | 2.7% |
| Maximum | 100.0% | 41.0% |
| Range | 97.1% | 38.2% |
| Mean | 36.3% | 19.1% |
| Median | 30.7% | 19.1% |
| Interquartile 25% (IQ1) | 20.3% | 14.8% |
| Interquartile 75% (IQ3) | 42.3% | 21.8% |
| Interquartile Range (IQR) | 22.0% | 7.1% |
| Standard Deviation (Sample) | 25.0% | 7.8% |
| Standard Deviation (Population) | 24.8% | 7.7% |
Similar Demographics by Single Female Poverty
Demographics Similar to Yup'ik by Single Female Poverty
In terms of single female poverty, the demographic groups most similar to Yup'ik are Arapaho (26.4%, a difference of 0.64%), Seminole (26.8%, a difference of 0.74%), Chippewa (26.8%, a difference of 0.84%), Black/African American (26.4%, a difference of 0.95%), and Kiowa (26.9%, a difference of 1.3%).
| Demographics | Rating | Rank | Single Female Poverty |
| Cherokee | 0.0 /100 | #314 | Tragic 25.7% |
| Iroquois | 0.0 /100 | #315 | Tragic 25.7% |
| Immigrants | Somalia | 0.0 /100 | #316 | Tragic 25.8% |
| Ottawa | 0.0 /100 | #317 | Tragic 26.0% |
| Chickasaw | 0.0 /100 | #318 | Tragic 26.3% |
| Blacks/African Americans | 0.0 /100 | #319 | Tragic 26.4% |
| Arapaho | 0.0 /100 | #320 | Tragic 26.4% |
| Yup'ik | 0.0 /100 | #321 | Tragic 26.6% |
| Seminole | 0.0 /100 | #322 | Tragic 26.8% |
| Chippewa | 0.0 /100 | #323 | Tragic 26.8% |
| Kiowa | 0.0 /100 | #324 | Tragic 26.9% |
| Choctaw | 0.0 /100 | #325 | Tragic 27.2% |
| Creek | 0.0 /100 | #326 | Tragic 27.4% |
| Dutch West Indians | 0.0 /100 | #327 | Tragic 27.5% |
| Apache | 0.0 /100 | #328 | Tragic 27.7% |
Demographics Similar to Immigrants from Iraq by Single Female Poverty
In terms of single female poverty, the demographic groups most similar to Immigrants from Iraq are Immigrants from Canada (20.2%, a difference of 0.010%), Immigrants from Venezuela (20.2%, a difference of 0.050%), Immigrants from Nepal (20.3%, a difference of 0.12%), Immigrants from England (20.2%, a difference of 0.14%), and Slovene (20.3%, a difference of 0.15%).
| Demographics | Rating | Rank | Single Female Poverty |
| Immigrants | Spain | 92.7 /100 | #128 | Exceptional 20.2% |
| Immigrants | Morocco | 92.4 /100 | #129 | Exceptional 20.2% |
| Immigrants | Hungary | 92.3 /100 | #130 | Exceptional 20.2% |
| Pakistanis | 92.1 /100 | #131 | Exceptional 20.2% |
| Uruguayans | 92.1 /100 | #132 | Exceptional 20.2% |
| Immigrants | England | 91.9 /100 | #133 | Exceptional 20.2% |
| Immigrants | Venezuela | 91.5 /100 | #134 | Exceptional 20.2% |
| Immigrants | Iraq | 91.2 /100 | #135 | Exceptional 20.2% |
| Immigrants | Canada | 91.2 /100 | #136 | Exceptional 20.2% |
| Immigrants | Nepal | 90.6 /100 | #137 | Exceptional 20.3% |
| Slovenes | 90.5 /100 | #138 | Exceptional 20.3% |
| Immigrants | Kuwait | 90.4 /100 | #139 | Exceptional 20.3% |
| Syrians | 90.4 /100 | #140 | Exceptional 20.3% |
| Immigrants | North America | 89.5 /100 | #141 | Excellent 20.3% |
| Immigrants | Uganda | 89.1 /100 | #142 | Excellent 20.3% |