Puerto Rican vs Guamanian/Chamorro Single Female Poverty
COMPARE
Puerto Rican
Guamanian/Chamorro
Single Female Poverty
Single Female Poverty Comparison
Puerto Ricans
Guamanians/Chamorros
34.1%
SINGLE FEMALE POVERTY
0.0/ 100
METRIC RATING
346th/ 347
METRIC RANK
21.6%
SINGLE FEMALE POVERTY
13.7/ 100
METRIC RATING
213th/ 347
METRIC RANK
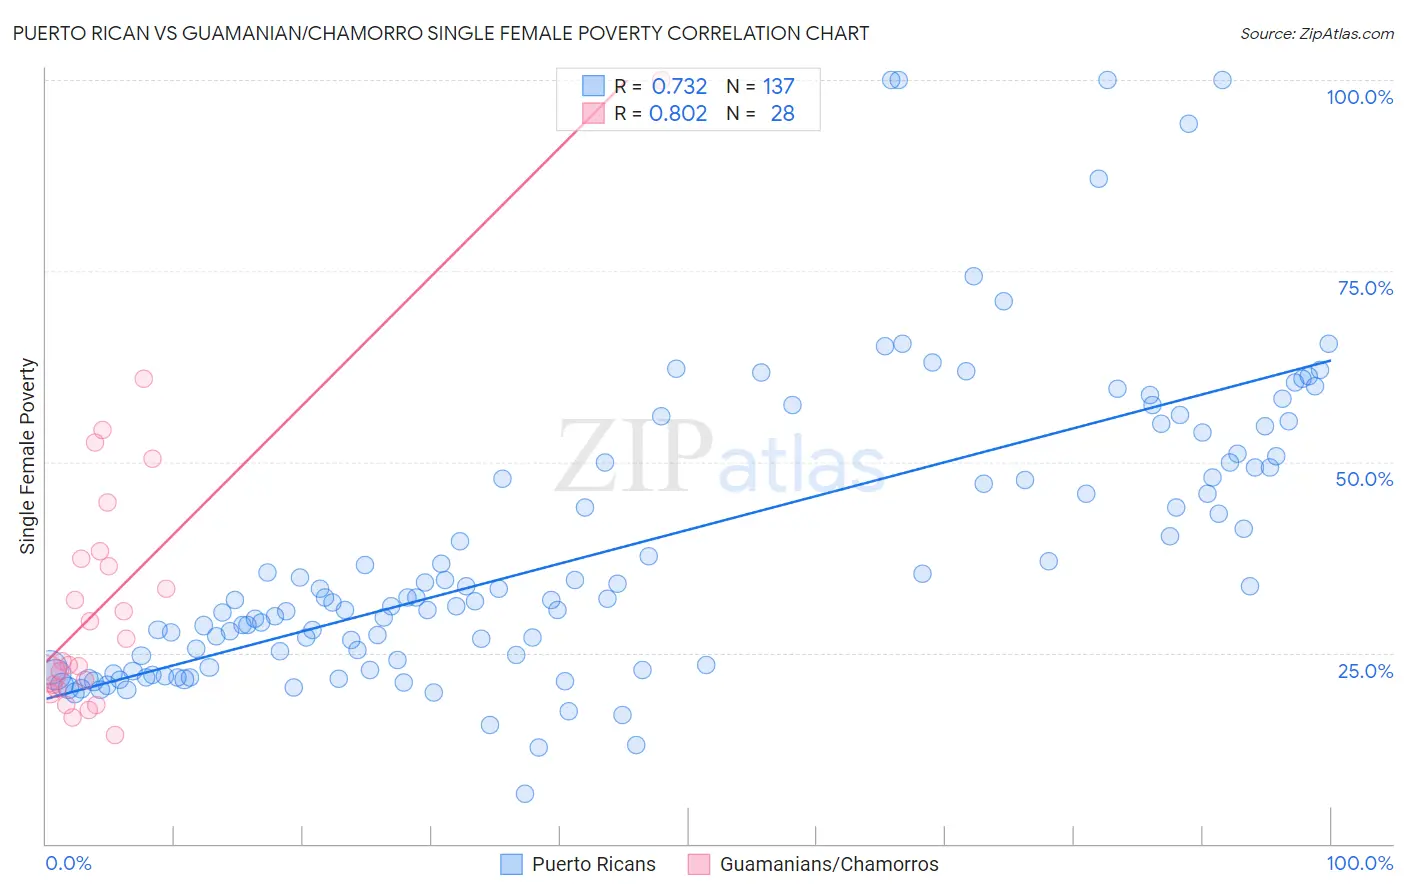
Puerto Rican vs Guamanian/Chamorro Single Female Poverty Correlation Chart
The statistical analysis conducted on geographies consisting of 515,297,886 people shows a strong positive correlation between the proportion of Puerto Ricans and poverty level among single females in the United States with a correlation coefficient (R) of 0.732 and weighted average of 34.1%. Similarly, the statistical analysis conducted on geographies consisting of 220,498,532 people shows a very strong positive correlation between the proportion of Guamanians/Chamorros and poverty level among single females in the United States with a correlation coefficient (R) of 0.802 and weighted average of 21.6%, a difference of 57.8%.
Single Female Poverty Correlation Summary
| Measurement | Puerto Rican | Guamanian/Chamorro |
| Minimum | 6.5% | 14.3% |
| Maximum | 100.0% | 100.0% |
| Range | 93.5% | 85.7% |
| Mean | 38.4% | 32.5% |
| Median | 31.9% | 25.4% |
| Interquartile 25% (IQ1) | 23.2% | 20.5% |
| Interquartile 75% (IQ3) | 49.9% | 37.8% |
| Interquartile Range (IQR) | 26.7% | 17.3% |
| Standard Deviation (Sample) | 19.4% | 18.3% |
| Standard Deviation (Population) | 19.3% | 18.0% |
Similar Demographics by Single Female Poverty
Demographics Similar to Puerto Ricans by Single Female Poverty
In terms of single female poverty, the demographic groups most similar to Puerto Ricans are Tohono O'odham (34.2%, a difference of 0.30%), Houma (33.8%, a difference of 0.92%), Lumbee (33.0%, a difference of 3.3%), Crow (32.4%, a difference of 5.2%), and Navajo (31.7%, a difference of 7.7%).
| Demographics | Rating | Rank | Single Female Poverty |
| Ute | 0.0 /100 | #333 | Tragic 28.4% |
| Pueblo | 0.0 /100 | #334 | Tragic 28.6% |
| Immigrants | Yemen | 0.0 /100 | #335 | Tragic 28.9% |
| Colville | 0.0 /100 | #336 | Tragic 29.1% |
| Yuman | 0.0 /100 | #337 | Tragic 29.4% |
| Pima | 0.0 /100 | #338 | Tragic 30.3% |
| Cheyenne | 0.0 /100 | #339 | Tragic 30.4% |
| Cajuns | 0.0 /100 | #340 | Tragic 30.6% |
| Sioux | 0.0 /100 | #341 | Tragic 31.3% |
| Navajo | 0.0 /100 | #342 | Tragic 31.7% |
| Crow | 0.0 /100 | #343 | Tragic 32.4% |
| Lumbee | 0.0 /100 | #344 | Tragic 33.0% |
| Houma | 0.0 /100 | #345 | Tragic 33.8% |
| Puerto Ricans | 0.0 /100 | #346 | Tragic 34.1% |
| Tohono O'odham | 0.0 /100 | #347 | Tragic 34.2% |
Demographics Similar to Guamanians/Chamorros by Single Female Poverty
In terms of single female poverty, the demographic groups most similar to Guamanians/Chamorros are Jamaican (21.6%, a difference of 0.030%), Icelander (21.6%, a difference of 0.040%), Immigrants from Nicaragua (21.6%, a difference of 0.060%), Immigrants from Panama (21.6%, a difference of 0.080%), and Immigrants from Eastern Africa (21.6%, a difference of 0.17%).
| Demographics | Rating | Rank | Single Female Poverty |
| Belgians | 16.1 /100 | #206 | Poor 21.5% |
| Ghanaians | 15.7 /100 | #207 | Poor 21.6% |
| Haitians | 15.4 /100 | #208 | Poor 21.6% |
| Immigrants | Eastern Africa | 15.1 /100 | #209 | Poor 21.6% |
| Immigrants | Panama | 14.4 /100 | #210 | Poor 21.6% |
| Icelanders | 14.0 /100 | #211 | Poor 21.6% |
| Jamaicans | 14.0 /100 | #212 | Poor 21.6% |
| Guamanians/Chamorros | 13.7 /100 | #213 | Poor 21.6% |
| Immigrants | Nicaragua | 13.3 /100 | #214 | Poor 21.6% |
| Ecuadorians | 12.3 /100 | #215 | Poor 21.6% |
| Immigrants | Barbados | 12.2 /100 | #216 | Poor 21.7% |
| Immigrants | St. Vincent and the Grenadines | 11.7 /100 | #217 | Poor 21.7% |
| Nepalese | 9.7 /100 | #218 | Tragic 21.7% |
| Panamanians | 9.4 /100 | #219 | Tragic 21.7% |
| Germans | 8.3 /100 | #220 | Tragic 21.8% |