Yup'ik vs Senegalese Single Female Poverty
COMPARE
Yup'ik
Senegalese
Single Female Poverty
Single Female Poverty Comparison
Yup'ik
Senegalese
26.6%
SINGLE FEMALE POVERTY
0.0/ 100
METRIC RATING
321st/ 347
METRIC RANK
23.0%
SINGLE FEMALE POVERTY
0.2/ 100
METRIC RATING
267th/ 347
METRIC RANK
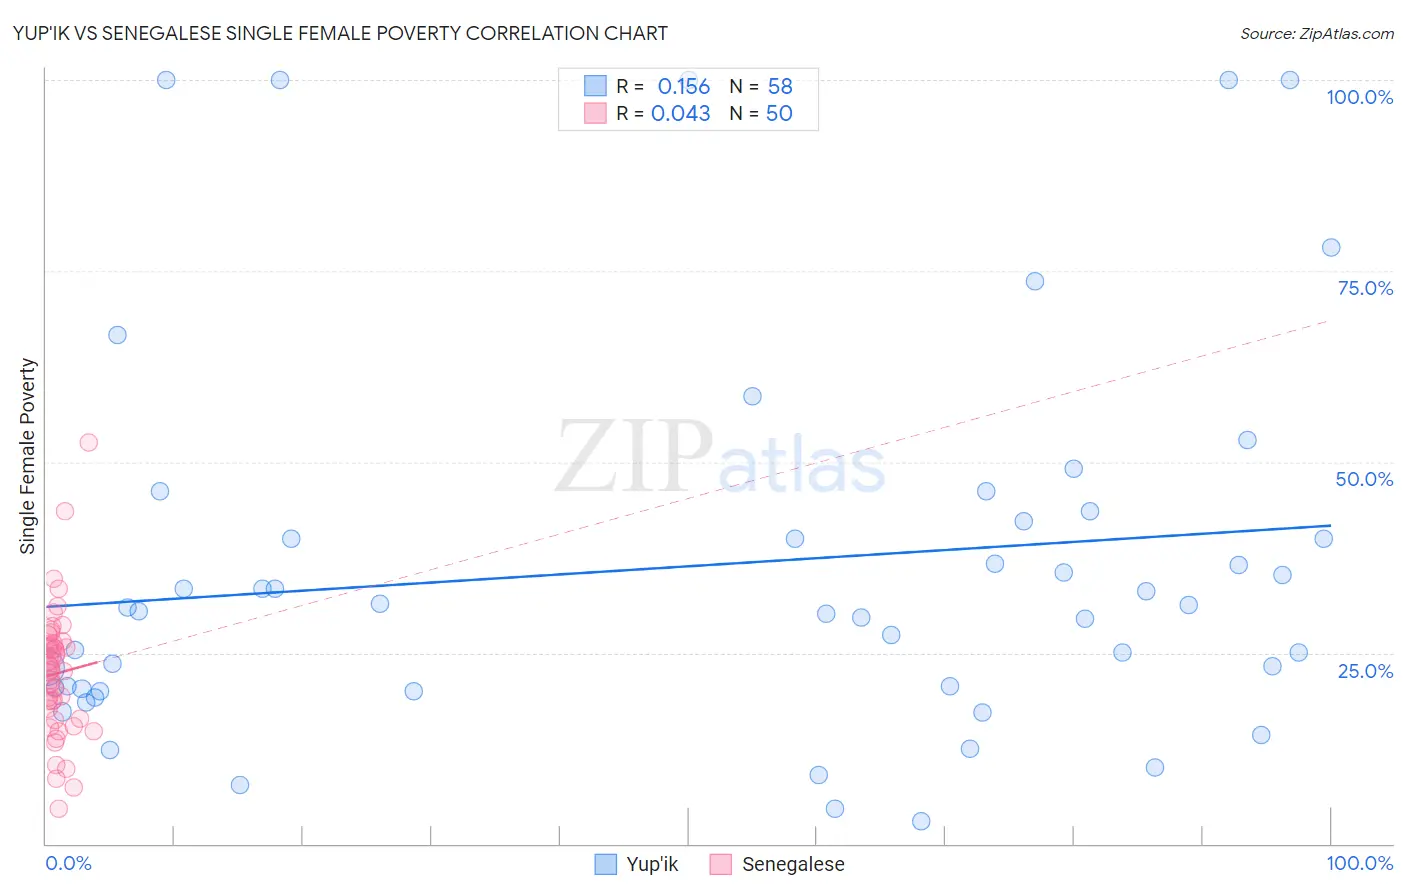
Yup'ik vs Senegalese Single Female Poverty Correlation Chart
The statistical analysis conducted on geographies consisting of 39,804,505 people shows a poor positive correlation between the proportion of Yup'ik and poverty level among single females in the United States with a correlation coefficient (R) of 0.156 and weighted average of 26.6%. Similarly, the statistical analysis conducted on geographies consisting of 77,927,948 people shows no correlation between the proportion of Senegalese and poverty level among single females in the United States with a correlation coefficient (R) of 0.043 and weighted average of 23.0%, a difference of 15.4%.
Single Female Poverty Correlation Summary
| Measurement | Yup'ik | Senegalese |
| Minimum | 2.9% | 4.5% |
| Maximum | 100.0% | 52.6% |
| Range | 97.1% | 48.1% |
| Mean | 36.3% | 22.3% |
| Median | 30.7% | 22.7% |
| Interquartile 25% (IQ1) | 20.3% | 16.3% |
| Interquartile 75% (IQ3) | 42.3% | 26.2% |
| Interquartile Range (IQR) | 22.0% | 9.9% |
| Standard Deviation (Sample) | 25.0% | 8.6% |
| Standard Deviation (Population) | 24.8% | 8.5% |
Similar Demographics by Single Female Poverty
Demographics Similar to Yup'ik by Single Female Poverty
In terms of single female poverty, the demographic groups most similar to Yup'ik are Arapaho (26.4%, a difference of 0.64%), Seminole (26.8%, a difference of 0.74%), Chippewa (26.8%, a difference of 0.84%), Black/African American (26.4%, a difference of 0.95%), and Kiowa (26.9%, a difference of 1.3%).
| Demographics | Rating | Rank | Single Female Poverty |
| Cherokee | 0.0 /100 | #314 | Tragic 25.7% |
| Iroquois | 0.0 /100 | #315 | Tragic 25.7% |
| Immigrants | Somalia | 0.0 /100 | #316 | Tragic 25.8% |
| Ottawa | 0.0 /100 | #317 | Tragic 26.0% |
| Chickasaw | 0.0 /100 | #318 | Tragic 26.3% |
| Blacks/African Americans | 0.0 /100 | #319 | Tragic 26.4% |
| Arapaho | 0.0 /100 | #320 | Tragic 26.4% |
| Yup'ik | 0.0 /100 | #321 | Tragic 26.6% |
| Seminole | 0.0 /100 | #322 | Tragic 26.8% |
| Chippewa | 0.0 /100 | #323 | Tragic 26.8% |
| Kiowa | 0.0 /100 | #324 | Tragic 26.9% |
| Choctaw | 0.0 /100 | #325 | Tragic 27.2% |
| Creek | 0.0 /100 | #326 | Tragic 27.4% |
| Dutch West Indians | 0.0 /100 | #327 | Tragic 27.5% |
| Apache | 0.0 /100 | #328 | Tragic 27.7% |
Demographics Similar to Senegalese by Single Female Poverty
In terms of single female poverty, the demographic groups most similar to Senegalese are Immigrants from Micronesia (23.0%, a difference of 0.060%), Fijian (23.1%, a difference of 0.070%), Hmong (23.1%, a difference of 0.10%), Central American (23.0%, a difference of 0.27%), and Inupiat (23.1%, a difference of 0.35%).
| Demographics | Rating | Rank | Single Female Poverty |
| Celtics | 0.5 /100 | #260 | Tragic 22.7% |
| Immigrants | Cabo Verde | 0.4 /100 | #261 | Tragic 22.8% |
| British West Indians | 0.4 /100 | #262 | Tragic 22.8% |
| Scotch-Irish | 0.3 /100 | #263 | Tragic 22.9% |
| Immigrants | Laos | 0.3 /100 | #264 | Tragic 22.9% |
| Central Americans | 0.2 /100 | #265 | Tragic 23.0% |
| Immigrants | Micronesia | 0.2 /100 | #266 | Tragic 23.0% |
| Senegalese | 0.2 /100 | #267 | Tragic 23.0% |
| Fijians | 0.2 /100 | #268 | Tragic 23.1% |
| Hmong | 0.2 /100 | #269 | Tragic 23.1% |
| Inupiat | 0.2 /100 | #270 | Tragic 23.1% |
| Sub-Saharan Africans | 0.1 /100 | #271 | Tragic 23.2% |
| Immigrants | Senegal | 0.1 /100 | #272 | Tragic 23.2% |
| Alaska Natives | 0.1 /100 | #273 | Tragic 23.3% |
| Marshallese | 0.1 /100 | #274 | Tragic 23.3% |