Immigrants from Austria vs Immigrants from Moldova Female Poverty
COMPARE
Immigrants from Austria
Immigrants from Moldova
Female Poverty
Female Poverty Comparison
Immigrants from Austria
Immigrants from Moldova
12.0%
FEMALE POVERTY
98.7/ 100
METRIC RATING
53rd/ 347
METRIC RANK
11.9%
FEMALE POVERTY
99.2/ 100
METRIC RATING
42nd/ 347
METRIC RANK
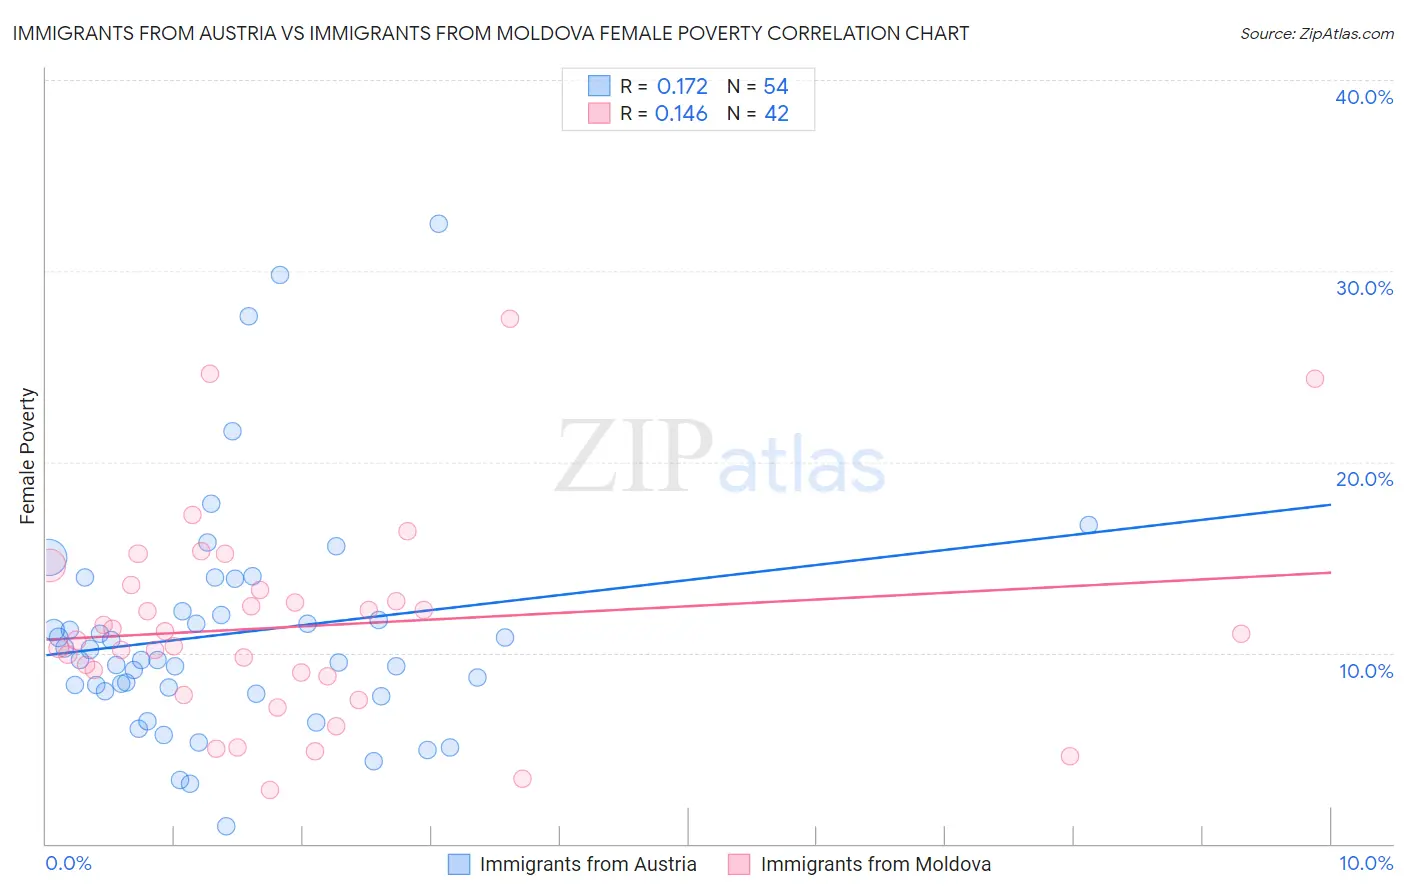
Immigrants from Austria vs Immigrants from Moldova Female Poverty Correlation Chart
The statistical analysis conducted on geographies consisting of 167,923,164 people shows a poor positive correlation between the proportion of Immigrants from Austria and poverty level among females in the United States with a correlation coefficient (R) of 0.172 and weighted average of 12.0%. Similarly, the statistical analysis conducted on geographies consisting of 124,368,843 people shows a poor positive correlation between the proportion of Immigrants from Moldova and poverty level among females in the United States with a correlation coefficient (R) of 0.146 and weighted average of 11.9%, a difference of 1.4%.
Female Poverty Correlation Summary
| Measurement | Immigrants from Austria | Immigrants from Moldova |
| Minimum | 0.92% | 2.8% |
| Maximum | 32.5% | 27.5% |
| Range | 31.6% | 24.7% |
| Mean | 11.0% | 11.4% |
| Median | 9.6% | 10.8% |
| Interquartile 25% (IQ1) | 8.0% | 8.7% |
| Interquartile 75% (IQ3) | 12.2% | 13.3% |
| Interquartile Range (IQR) | 4.2% | 4.6% |
| Standard Deviation (Sample) | 6.0% | 5.3% |
| Standard Deviation (Population) | 6.0% | 5.2% |
Demographics Similar to Immigrants from Austria and Immigrants from Moldova by Female Poverty
In terms of female poverty, the demographic groups most similar to Immigrants from Austria are Immigrants from Croatia (12.0%, a difference of 0.010%), Immigrants from Philippines (12.1%, a difference of 0.14%), Immigrants from Bulgaria (12.0%, a difference of 0.31%), Immigrants from Sri Lanka (12.1%, a difference of 0.50%), and Slovene (12.0%, a difference of 0.53%). Similarly, the demographic groups most similar to Immigrants from Moldova are Czech (11.9%, a difference of 0.0%), Korean (11.9%, a difference of 0.040%), Tongan (11.9%, a difference of 0.11%), Macedonian (11.8%, a difference of 0.18%), and Immigrants from Czechoslovakia (11.9%, a difference of 0.20%).
| Demographics | Rating | Rank | Female Poverty |
| Immigrants | Greece | 99.3 /100 | #37 | Exceptional 11.8% |
| Russians | 99.3 /100 | #38 | Exceptional 11.8% |
| Immigrants | Poland | 99.3 /100 | #39 | Exceptional 11.8% |
| Macedonians | 99.3 /100 | #40 | Exceptional 11.8% |
| Czechs | 99.2 /100 | #41 | Exceptional 11.9% |
| Immigrants | Moldova | 99.2 /100 | #42 | Exceptional 11.9% |
| Koreans | 99.2 /100 | #43 | Exceptional 11.9% |
| Tongans | 99.2 /100 | #44 | Exceptional 11.9% |
| Immigrants | Czechoslovakia | 99.2 /100 | #45 | Exceptional 11.9% |
| Turks | 99.2 /100 | #46 | Exceptional 11.9% |
| Asians | 99.1 /100 | #47 | Exceptional 11.9% |
| Immigrants | Japan | 99.0 /100 | #48 | Exceptional 11.9% |
| Immigrants | Romania | 99.0 /100 | #49 | Exceptional 12.0% |
| Slovenes | 98.9 /100 | #50 | Exceptional 12.0% |
| Immigrants | Bulgaria | 98.9 /100 | #51 | Exceptional 12.0% |
| Immigrants | Croatia | 98.7 /100 | #52 | Exceptional 12.0% |
| Immigrants | Austria | 98.7 /100 | #53 | Exceptional 12.0% |
| Immigrants | Philippines | 98.7 /100 | #54 | Exceptional 12.1% |
| Immigrants | Sri Lanka | 98.5 /100 | #55 | Exceptional 12.1% |
| Estonians | 98.3 /100 | #56 | Exceptional 12.1% |
| Immigrants | Serbia | 98.3 /100 | #57 | Exceptional 12.1% |