Yugoslavian vs Immigrants from Moldova Ambulatory Disability
COMPARE
Yugoslavian
Immigrants from Moldova
Ambulatory Disability
Ambulatory Disability Comparison
Yugoslavians
Immigrants from Moldova
6.3%
AMBULATORY DISABILITY
10.9/ 100
METRIC RATING
217th/ 347
METRIC RANK
6.0%
AMBULATORY DISABILITY
82.4/ 100
METRIC RATING
147th/ 347
METRIC RANK
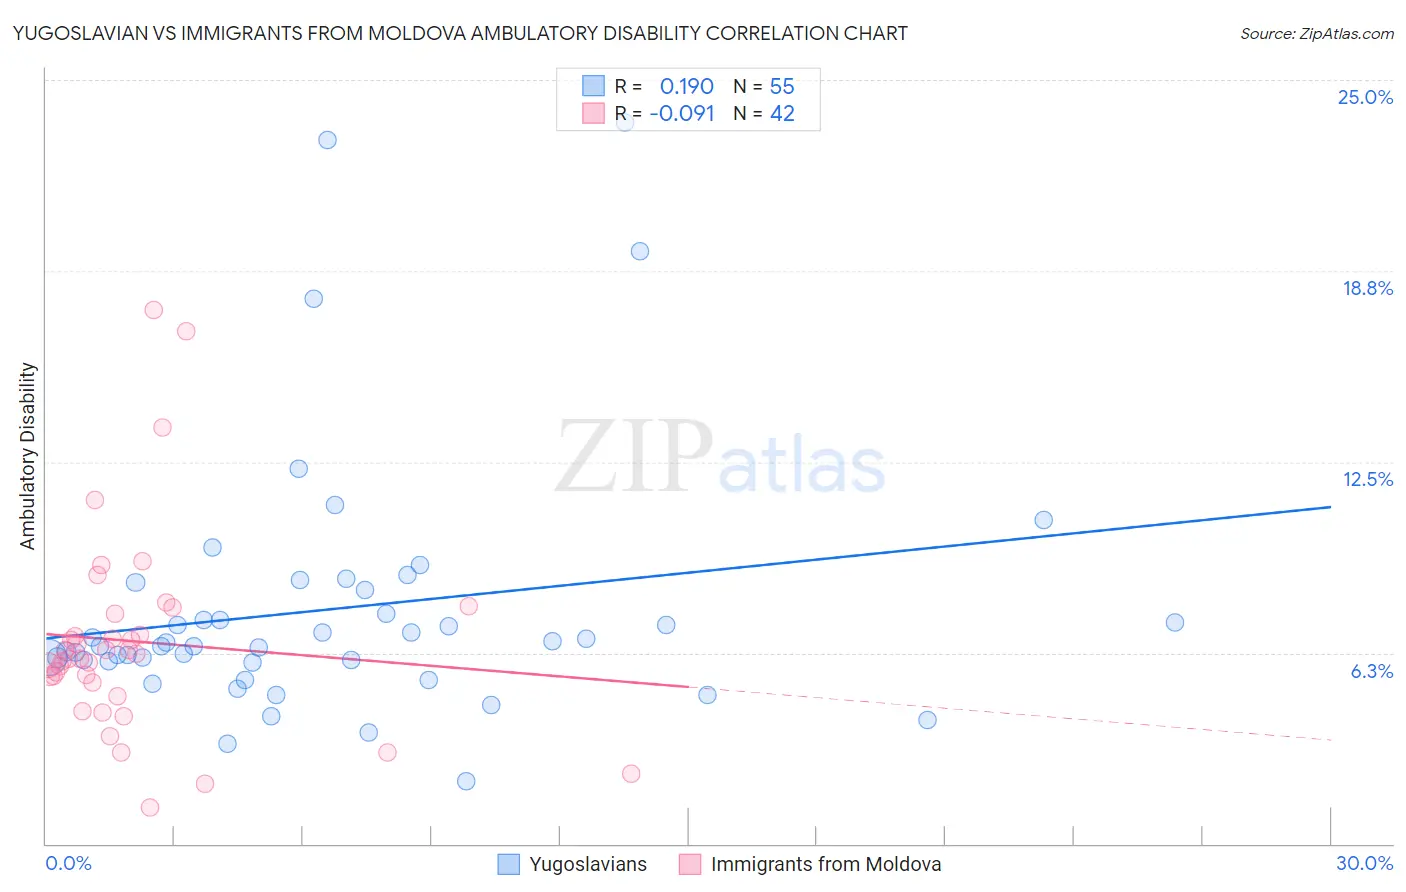
Yugoslavian vs Immigrants from Moldova Ambulatory Disability Correlation Chart
The statistical analysis conducted on geographies consisting of 285,658,107 people shows a poor positive correlation between the proportion of Yugoslavians and percentage of population with ambulatory disability in the United States with a correlation coefficient (R) of 0.190 and weighted average of 6.3%. Similarly, the statistical analysis conducted on geographies consisting of 124,381,325 people shows a slight negative correlation between the proportion of Immigrants from Moldova and percentage of population with ambulatory disability in the United States with a correlation coefficient (R) of -0.091 and weighted average of 6.0%, a difference of 4.9%.
Ambulatory Disability Correlation Summary
| Measurement | Yugoslavian | Immigrants from Moldova |
| Minimum | 2.0% | 1.2% |
| Maximum | 23.6% | 17.5% |
| Range | 21.6% | 16.3% |
| Mean | 7.7% | 6.6% |
| Median | 6.5% | 6.1% |
| Interquartile 25% (IQ1) | 6.0% | 5.3% |
| Interquartile 75% (IQ3) | 8.3% | 7.5% |
| Interquartile Range (IQR) | 2.3% | 2.2% |
| Standard Deviation (Sample) | 4.2% | 3.3% |
| Standard Deviation (Population) | 4.2% | 3.3% |
Similar Demographics by Ambulatory Disability
Demographics Similar to Yugoslavians by Ambulatory Disability
In terms of ambulatory disability, the demographic groups most similar to Yugoslavians are Canadian (6.3%, a difference of 0.0%), Immigrants from Latin America (6.3%, a difference of 0.010%), Immigrants from Mexico (6.3%, a difference of 0.020%), Guamanian/Chamorro (6.3%, a difference of 0.040%), and Mexican American Indian (6.3%, a difference of 0.14%).
| Demographics | Rating | Rank | Ambulatory Disability |
| Immigrants | Laos | 13.2 /100 | #210 | Poor 6.3% |
| Samoans | 12.1 /100 | #211 | Poor 6.3% |
| Mexican American Indians | 12.0 /100 | #212 | Poor 6.3% |
| Japanese | 12.0 /100 | #213 | Poor 6.3% |
| Immigrants | Mexico | 11.0 /100 | #214 | Poor 6.3% |
| Immigrants | Latin America | 11.0 /100 | #215 | Poor 6.3% |
| Canadians | 10.9 /100 | #216 | Poor 6.3% |
| Yugoslavians | 10.9 /100 | #217 | Poor 6.3% |
| Guamanians/Chamorros | 10.6 /100 | #218 | Poor 6.3% |
| Indonesians | 9.9 /100 | #219 | Tragic 6.3% |
| Immigrants | Albania | 9.6 /100 | #220 | Tragic 6.3% |
| Hungarians | 9.6 /100 | #221 | Tragic 6.3% |
| German Russians | 9.4 /100 | #222 | Tragic 6.3% |
| Immigrants | Honduras | 7.6 /100 | #223 | Tragic 6.3% |
| Liberians | 7.1 /100 | #224 | Tragic 6.3% |
Demographics Similar to Immigrants from Moldova by Ambulatory Disability
In terms of ambulatory disability, the demographic groups most similar to Immigrants from Moldova are Pakistani (6.0%, a difference of 0.010%), Immigrants from Greece (6.0%, a difference of 0.010%), Macedonian (6.0%, a difference of 0.040%), Immigrants from Eastern Europe (6.0%, a difference of 0.040%), and Romanian (6.0%, a difference of 0.050%).
| Demographics | Rating | Rank | Ambulatory Disability |
| Czechs | 83.3 /100 | #140 | Excellent 6.0% |
| Swedes | 83.1 /100 | #141 | Excellent 6.0% |
| Immigrants | Philippines | 83.0 /100 | #142 | Excellent 6.0% |
| Romanians | 82.9 /100 | #143 | Excellent 6.0% |
| Macedonians | 82.8 /100 | #144 | Excellent 6.0% |
| Pakistanis | 82.5 /100 | #145 | Excellent 6.0% |
| Immigrants | Greece | 82.5 /100 | #146 | Excellent 6.0% |
| Immigrants | Moldova | 82.4 /100 | #147 | Excellent 6.0% |
| Immigrants | Eastern Europe | 82.0 /100 | #148 | Excellent 6.0% |
| Lithuanians | 81.9 /100 | #149 | Excellent 6.0% |
| Maltese | 81.6 /100 | #150 | Excellent 6.0% |
| Greeks | 79.6 /100 | #151 | Good 6.0% |
| Immigrants | Austria | 78.8 /100 | #152 | Good 6.0% |
| Syrians | 75.5 /100 | #153 | Good 6.0% |
| Immigrants | Croatia | 75.1 /100 | #154 | Good 6.0% |