West Indian vs Colombian Male Unemployment
COMPARE
West Indian
Colombian
Male Unemployment
Male Unemployment Comparison
West Indians
Colombians
6.7%
MALE UNEMPLOYMENT
0.0/ 100
METRIC RATING
304th/ 347
METRIC RANK
5.2%
MALE UNEMPLOYMENT
81.1/ 100
METRIC RATING
133rd/ 347
METRIC RANK
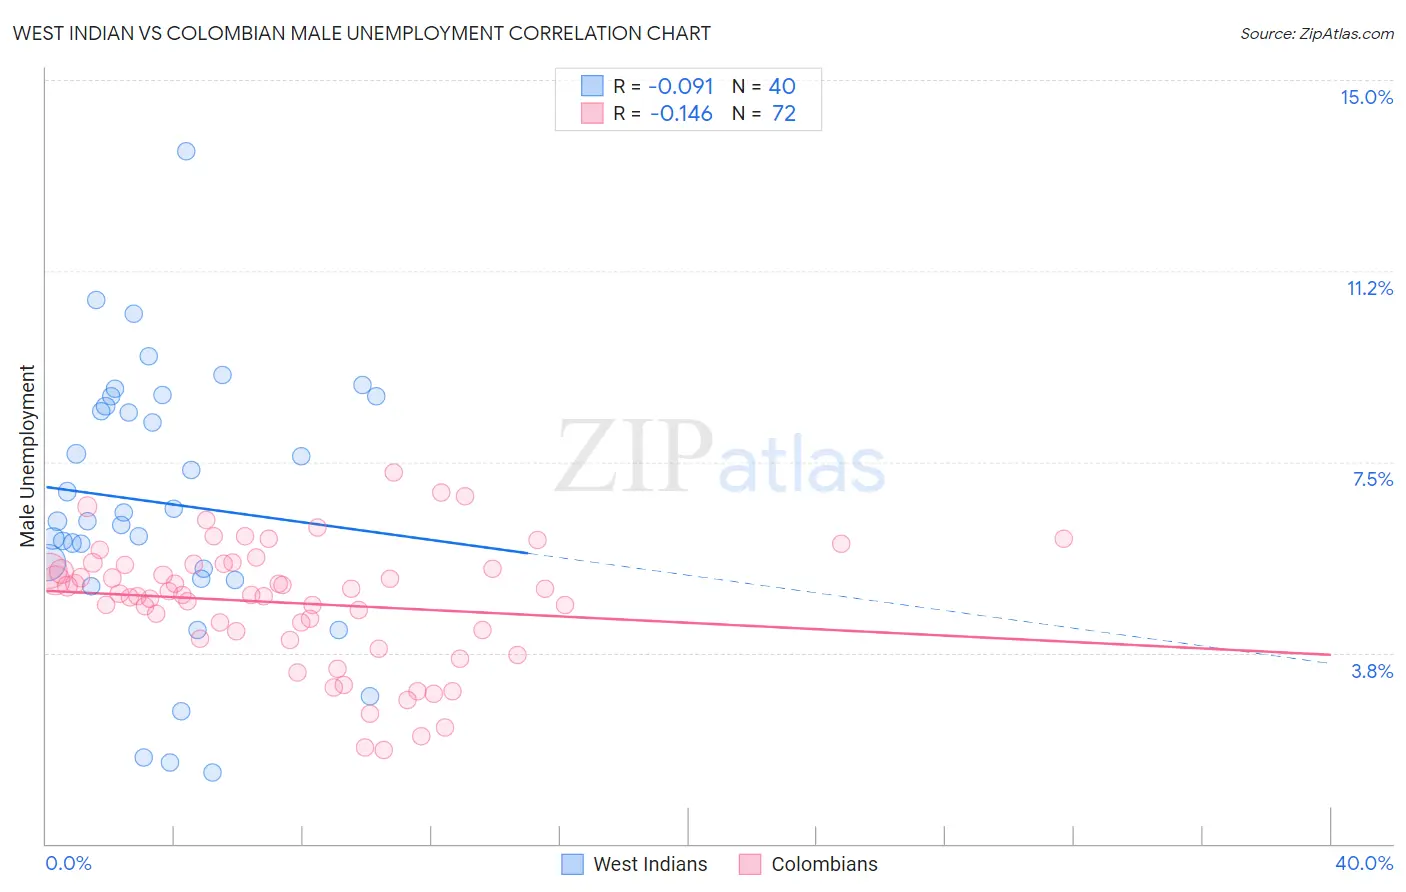
West Indian vs Colombian Male Unemployment Correlation Chart
The statistical analysis conducted on geographies consisting of 253,602,585 people shows a slight negative correlation between the proportion of West Indians and unemployment rate among males in the United States with a correlation coefficient (R) of -0.091 and weighted average of 6.7%. Similarly, the statistical analysis conducted on geographies consisting of 417,848,253 people shows a poor negative correlation between the proportion of Colombians and unemployment rate among males in the United States with a correlation coefficient (R) of -0.146 and weighted average of 5.2%, a difference of 28.5%.
Male Unemployment Correlation Summary
| Measurement | West Indian | Colombian |
| Minimum | 1.4% | 1.8% |
| Maximum | 13.6% | 7.3% |
| Range | 12.2% | 5.4% |
| Mean | 6.7% | 4.7% |
| Median | 6.4% | 4.9% |
| Interquartile 25% (IQ1) | 5.3% | 4.1% |
| Interquartile 75% (IQ3) | 8.7% | 5.5% |
| Interquartile Range (IQR) | 3.4% | 1.4% |
| Standard Deviation (Sample) | 2.6% | 1.2% |
| Standard Deviation (Population) | 2.6% | 1.2% |
Similar Demographics by Male Unemployment
Demographics Similar to West Indians by Male Unemployment
In terms of male unemployment, the demographic groups most similar to West Indians are Immigrants from West Indies (6.7%, a difference of 0.0%), Trinidadian and Tobagonian (6.7%, a difference of 0.32%), Ute (6.6%, a difference of 0.37%), Immigrants from Trinidad and Tobago (6.7%, a difference of 0.52%), and Immigrants from Jamaica (6.7%, a difference of 0.60%).
| Demographics | Rating | Rank | Male Unemployment |
| Chippewa | 0.0 /100 | #297 | Tragic 6.6% |
| Jamaicans | 0.0 /100 | #298 | Tragic 6.6% |
| Immigrants | Bangladesh | 0.0 /100 | #299 | Tragic 6.6% |
| Vietnamese | 0.0 /100 | #300 | Tragic 6.6% |
| Immigrants | Belize | 0.0 /100 | #301 | Tragic 6.6% |
| Ute | 0.0 /100 | #302 | Tragic 6.6% |
| Immigrants | West Indies | 0.0 /100 | #303 | Tragic 6.7% |
| West Indians | 0.0 /100 | #304 | Tragic 6.7% |
| Trinidadians and Tobagonians | 0.0 /100 | #305 | Tragic 6.7% |
| Immigrants | Trinidad and Tobago | 0.0 /100 | #306 | Tragic 6.7% |
| Immigrants | Jamaica | 0.0 /100 | #307 | Tragic 6.7% |
| Aleuts | 0.0 /100 | #308 | Tragic 6.8% |
| Barbadians | 0.0 /100 | #309 | Tragic 6.9% |
| Blacks/African Americans | 0.0 /100 | #310 | Tragic 6.9% |
| Immigrants | Armenia | 0.0 /100 | #311 | Tragic 6.9% |
Demographics Similar to Colombians by Male Unemployment
In terms of male unemployment, the demographic groups most similar to Colombians are Pakistani (5.2%, a difference of 0.060%), Immigrants from Saudi Arabia (5.2%, a difference of 0.090%), Lebanese (5.2%, a difference of 0.11%), Immigrants from Eastern Africa (5.2%, a difference of 0.12%), and Immigrants from Croatia (5.2%, a difference of 0.13%).
| Demographics | Rating | Rank | Male Unemployment |
| Immigrants | Colombia | 86.8 /100 | #126 | Excellent 5.1% |
| Immigrants | Brazil | 86.3 /100 | #127 | Excellent 5.2% |
| Hungarians | 85.1 /100 | #128 | Excellent 5.2% |
| Immigrants | Western Europe | 84.8 /100 | #129 | Excellent 5.2% |
| Immigrants | Malaysia | 83.5 /100 | #130 | Excellent 5.2% |
| Immigrants | Germany | 83.0 /100 | #131 | Excellent 5.2% |
| Chickasaw | 82.9 /100 | #132 | Excellent 5.2% |
| Colombians | 81.1 /100 | #133 | Excellent 5.2% |
| Pakistanis | 80.5 /100 | #134 | Excellent 5.2% |
| Immigrants | Saudi Arabia | 80.1 /100 | #135 | Excellent 5.2% |
| Lebanese | 79.9 /100 | #136 | Good 5.2% |
| Immigrants | Eastern Africa | 79.8 /100 | #137 | Good 5.2% |
| Immigrants | Croatia | 79.7 /100 | #138 | Good 5.2% |
| Kenyans | 79.4 /100 | #139 | Good 5.2% |
| Brazilians | 79.3 /100 | #140 | Good 5.2% |