Syrian vs Immigrants from Zaire Single Father Poverty
COMPARE
Syrian
Immigrants from Zaire
Single Father Poverty
Single Father Poverty Comparison
Syrians
Immigrants from Zaire
16.6%
SINGLE FATHER POVERTY
17.4/ 100
METRIC RATING
200th/ 347
METRIC RANK
17.3%
SINGLE FATHER POVERTY
0.4/ 100
METRIC RATING
262nd/ 347
METRIC RANK
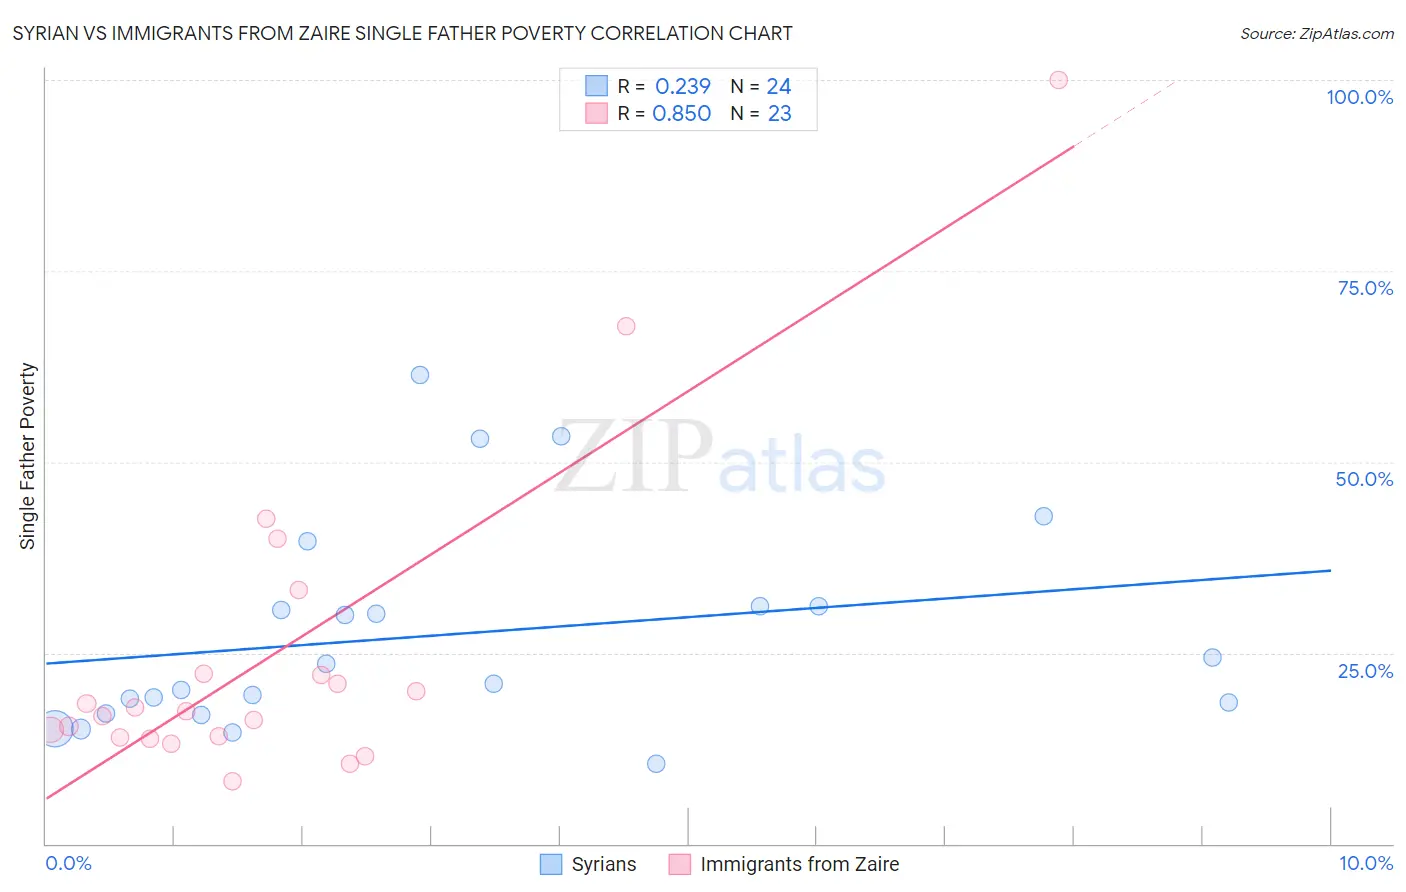
Syrian vs Immigrants from Zaire Single Father Poverty Correlation Chart
The statistical analysis conducted on geographies consisting of 216,304,035 people shows a weak positive correlation between the proportion of Syrians and poverty level among single fathers in the United States with a correlation coefficient (R) of 0.239 and weighted average of 16.6%. Similarly, the statistical analysis conducted on geographies consisting of 97,955,340 people shows a very strong positive correlation between the proportion of Immigrants from Zaire and poverty level among single fathers in the United States with a correlation coefficient (R) of 0.850 and weighted average of 17.3%, a difference of 4.3%.
Single Father Poverty Correlation Summary
| Measurement | Syrian | Immigrants from Zaire |
| Minimum | 10.4% | 8.2% |
| Maximum | 61.3% | 100.0% |
| Range | 50.9% | 91.8% |
| Mean | 27.4% | 24.8% |
| Median | 22.2% | 17.3% |
| Interquartile 25% (IQ1) | 17.7% | 14.0% |
| Interquartile 75% (IQ3) | 31.0% | 22.3% |
| Interquartile Range (IQR) | 13.3% | 8.3% |
| Standard Deviation (Sample) | 13.7% | 21.1% |
| Standard Deviation (Population) | 13.4% | 20.6% |
Similar Demographics by Single Father Poverty
Demographics Similar to Syrians by Single Father Poverty
In terms of single father poverty, the demographic groups most similar to Syrians are Cuban (16.6%, a difference of 0.070%), Immigrants from Croatia (16.6%, a difference of 0.070%), Immigrants from Belize (16.5%, a difference of 0.17%), Romanian (16.5%, a difference of 0.19%), and Immigrants from North America (16.6%, a difference of 0.19%).
| Demographics | Rating | Rank | Single Father Poverty |
| Ecuadorians | 24.5 /100 | #193 | Fair 16.5% |
| Cape Verdeans | 24.4 /100 | #194 | Fair 16.5% |
| Immigrants | Barbados | 24.3 /100 | #195 | Fair 16.5% |
| Immigrants | Canada | 21.9 /100 | #196 | Fair 16.5% |
| Immigrants | Northern Europe | 20.3 /100 | #197 | Fair 16.5% |
| Romanians | 20.1 /100 | #198 | Fair 16.5% |
| Immigrants | Belize | 19.8 /100 | #199 | Poor 16.5% |
| Syrians | 17.4 /100 | #200 | Poor 16.6% |
| Cubans | 16.5 /100 | #201 | Poor 16.6% |
| Immigrants | Croatia | 16.5 /100 | #202 | Poor 16.6% |
| Immigrants | North America | 15.1 /100 | #203 | Poor 16.6% |
| Immigrants | Guatemala | 14.8 /100 | #204 | Poor 16.6% |
| Venezuelans | 14.3 /100 | #205 | Poor 16.6% |
| Immigrants | Senegal | 13.7 /100 | #206 | Poor 16.6% |
| New Zealanders | 13.7 /100 | #207 | Poor 16.6% |
Demographics Similar to Immigrants from Zaire by Single Father Poverty
In terms of single father poverty, the demographic groups most similar to Immigrants from Zaire are Lithuanian (17.3%, a difference of 0.010%), Swiss (17.3%, a difference of 0.13%), Slovene (17.3%, a difference of 0.22%), Polish (17.3%, a difference of 0.22%), and Jamaican (17.3%, a difference of 0.27%).
| Demographics | Rating | Rank | Single Father Poverty |
| Sierra Leoneans | 0.8 /100 | #255 | Tragic 17.2% |
| Immigrants | Haiti | 0.8 /100 | #256 | Tragic 17.2% |
| Immigrants | Albania | 0.7 /100 | #257 | Tragic 17.2% |
| Albanians | 0.7 /100 | #258 | Tragic 17.2% |
| Immigrants | Jamaica | 0.7 /100 | #259 | Tragic 17.2% |
| Spaniards | 0.6 /100 | #260 | Tragic 17.2% |
| Swiss | 0.5 /100 | #261 | Tragic 17.3% |
| Immigrants | Zaire | 0.4 /100 | #262 | Tragic 17.3% |
| Lithuanians | 0.4 /100 | #263 | Tragic 17.3% |
| Slovenes | 0.3 /100 | #264 | Tragic 17.3% |
| Poles | 0.3 /100 | #265 | Tragic 17.3% |
| Jamaicans | 0.3 /100 | #266 | Tragic 17.3% |
| Haitians | 0.3 /100 | #267 | Tragic 17.3% |
| Immigrants | Caribbean | 0.3 /100 | #268 | Tragic 17.4% |
| Slavs | 0.3 /100 | #269 | Tragic 17.4% |