Finnish vs Immigrants from Zaire Single Father Poverty
COMPARE
Finnish
Immigrants from Zaire
Single Father Poverty
Single Father Poverty Comparison
Finns
Immigrants from Zaire
16.9%
SINGLE FATHER POVERTY
2.6/ 100
METRIC RATING
240th/ 347
METRIC RANK
17.3%
SINGLE FATHER POVERTY
0.4/ 100
METRIC RATING
262nd/ 347
METRIC RANK
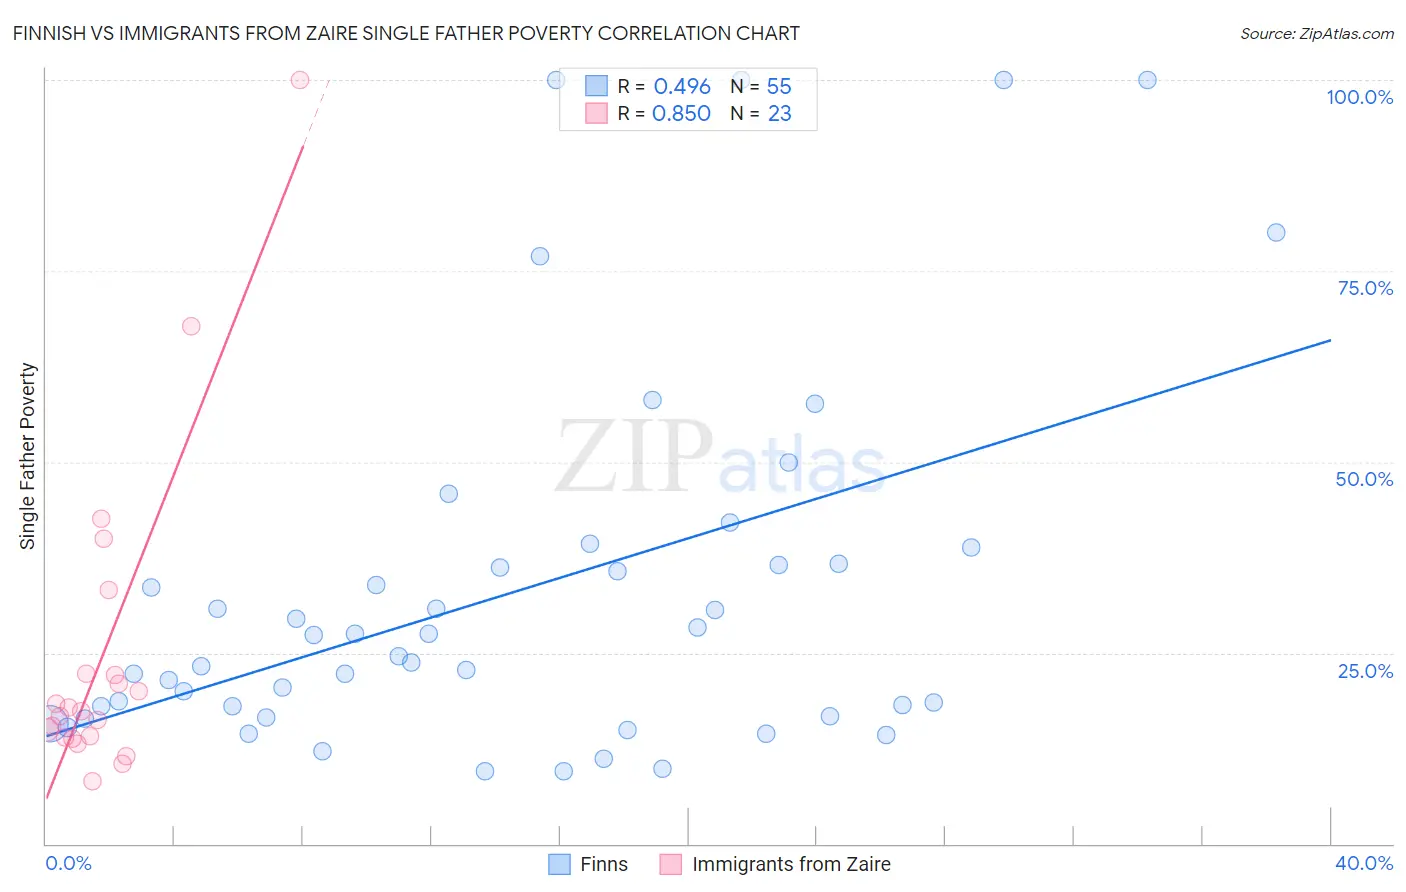
Finnish vs Immigrants from Zaire Single Father Poverty Correlation Chart
The statistical analysis conducted on geographies consisting of 310,078,024 people shows a moderate positive correlation between the proportion of Finns and poverty level among single fathers in the United States with a correlation coefficient (R) of 0.496 and weighted average of 16.9%. Similarly, the statistical analysis conducted on geographies consisting of 97,955,340 people shows a very strong positive correlation between the proportion of Immigrants from Zaire and poverty level among single fathers in the United States with a correlation coefficient (R) of 0.850 and weighted average of 17.3%, a difference of 2.0%.
Single Father Poverty Correlation Summary
| Measurement | Finnish | Immigrants from Zaire |
| Minimum | 9.5% | 8.2% |
| Maximum | 100.0% | 100.0% |
| Range | 90.5% | 91.8% |
| Mean | 33.0% | 24.8% |
| Median | 24.5% | 17.3% |
| Interquartile 25% (IQ1) | 16.7% | 14.0% |
| Interquartile 75% (IQ3) | 36.6% | 22.3% |
| Interquartile Range (IQR) | 20.0% | 8.3% |
| Standard Deviation (Sample) | 24.2% | 21.1% |
| Standard Deviation (Population) | 24.0% | 20.6% |
Similar Demographics by Single Father Poverty
Demographics Similar to Finns by Single Father Poverty
In terms of single father poverty, the demographic groups most similar to Finns are Bermudan (16.9%, a difference of 0.010%), Immigrants from Saudi Arabia (16.9%, a difference of 0.030%), Immigrants from Western Europe (16.9%, a difference of 0.10%), Immigrants from Germany (16.9%, a difference of 0.10%), and Subsaharan African (16.9%, a difference of 0.10%).
| Demographics | Rating | Rank | Single Father Poverty |
| Senegalese | 3.2 /100 | #233 | Tragic 16.9% |
| Marshallese | 3.1 /100 | #234 | Tragic 16.9% |
| Immigrants | Western Europe | 2.9 /100 | #235 | Tragic 16.9% |
| Immigrants | Germany | 2.9 /100 | #236 | Tragic 16.9% |
| Sub-Saharan Africans | 2.9 /100 | #237 | Tragic 16.9% |
| Immigrants | Saudi Arabia | 2.7 /100 | #238 | Tragic 16.9% |
| Bermudans | 2.6 /100 | #239 | Tragic 16.9% |
| Finns | 2.6 /100 | #240 | Tragic 16.9% |
| Czechs | 2.3 /100 | #241 | Tragic 17.0% |
| Moroccans | 2.1 /100 | #242 | Tragic 17.0% |
| Immigrants | Cabo Verde | 1.6 /100 | #243 | Tragic 17.0% |
| Hondurans | 1.6 /100 | #244 | Tragic 17.0% |
| Trinidadians and Tobagonians | 1.5 /100 | #245 | Tragic 17.0% |
| Immigrants | Ireland | 1.4 /100 | #246 | Tragic 17.1% |
| Greeks | 1.3 /100 | #247 | Tragic 17.1% |
Demographics Similar to Immigrants from Zaire by Single Father Poverty
In terms of single father poverty, the demographic groups most similar to Immigrants from Zaire are Lithuanian (17.3%, a difference of 0.010%), Swiss (17.3%, a difference of 0.13%), Slovene (17.3%, a difference of 0.22%), Polish (17.3%, a difference of 0.22%), and Jamaican (17.3%, a difference of 0.27%).
| Demographics | Rating | Rank | Single Father Poverty |
| Sierra Leoneans | 0.8 /100 | #255 | Tragic 17.2% |
| Immigrants | Haiti | 0.8 /100 | #256 | Tragic 17.2% |
| Immigrants | Albania | 0.7 /100 | #257 | Tragic 17.2% |
| Albanians | 0.7 /100 | #258 | Tragic 17.2% |
| Immigrants | Jamaica | 0.7 /100 | #259 | Tragic 17.2% |
| Spaniards | 0.6 /100 | #260 | Tragic 17.2% |
| Swiss | 0.5 /100 | #261 | Tragic 17.3% |
| Immigrants | Zaire | 0.4 /100 | #262 | Tragic 17.3% |
| Lithuanians | 0.4 /100 | #263 | Tragic 17.3% |
| Slovenes | 0.3 /100 | #264 | Tragic 17.3% |
| Poles | 0.3 /100 | #265 | Tragic 17.3% |
| Jamaicans | 0.3 /100 | #266 | Tragic 17.3% |
| Haitians | 0.3 /100 | #267 | Tragic 17.3% |
| Immigrants | Caribbean | 0.3 /100 | #268 | Tragic 17.4% |
| Slavs | 0.3 /100 | #269 | Tragic 17.4% |