French American Indian vs Immigrants from Zaire Single Father Poverty
COMPARE
French American Indian
Immigrants from Zaire
Single Father Poverty
Single Father Poverty Comparison
French American Indians
Immigrants from Zaire
17.4%
SINGLE FATHER POVERTY
0.2/ 100
METRIC RATING
271st/ 347
METRIC RANK
17.3%
SINGLE FATHER POVERTY
0.4/ 100
METRIC RATING
262nd/ 347
METRIC RANK
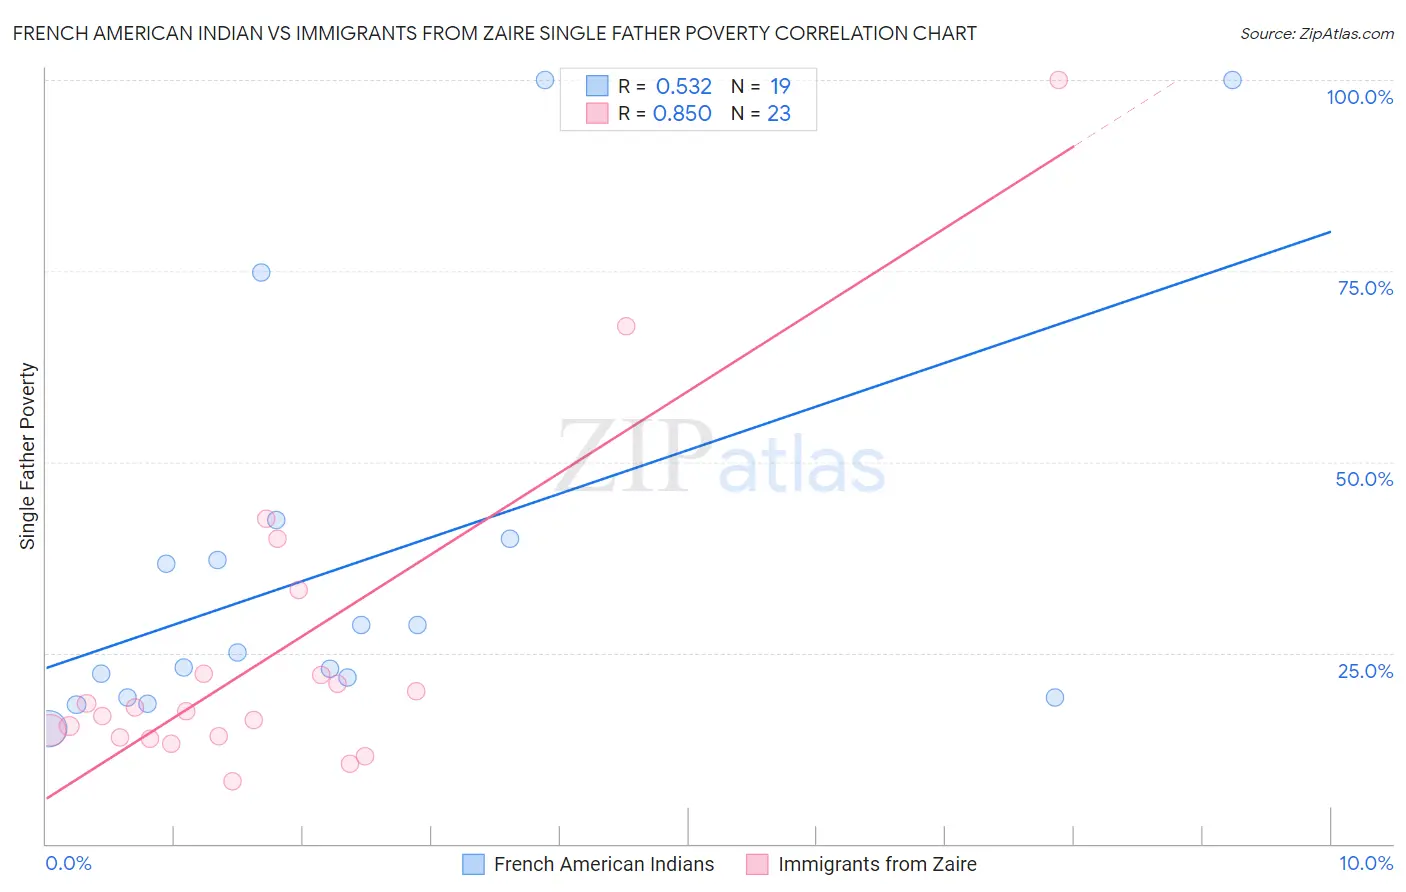
French American Indian vs Immigrants from Zaire Single Father Poverty Correlation Chart
The statistical analysis conducted on geographies consisting of 117,658,410 people shows a substantial positive correlation between the proportion of French American Indians and poverty level among single fathers in the United States with a correlation coefficient (R) of 0.532 and weighted average of 17.4%. Similarly, the statistical analysis conducted on geographies consisting of 97,955,340 people shows a very strong positive correlation between the proportion of Immigrants from Zaire and poverty level among single fathers in the United States with a correlation coefficient (R) of 0.850 and weighted average of 17.3%, a difference of 0.88%.
Single Father Poverty Correlation Summary
| Measurement | French American Indian | Immigrants from Zaire |
| Minimum | 15.1% | 8.2% |
| Maximum | 100.0% | 100.0% |
| Range | 84.9% | 91.8% |
| Mean | 36.5% | 24.8% |
| Median | 25.0% | 17.3% |
| Interquartile 25% (IQ1) | 19.2% | 14.0% |
| Interquartile 75% (IQ3) | 40.0% | 22.3% |
| Interquartile Range (IQR) | 20.8% | 8.3% |
| Standard Deviation (Sample) | 26.2% | 21.1% |
| Standard Deviation (Population) | 25.5% | 20.6% |
Demographics Similar to French American Indians and Immigrants from Zaire by Single Father Poverty
In terms of single father poverty, the demographic groups most similar to French American Indians are Indonesian (17.4%, a difference of 0.14%), Barbadian (17.5%, a difference of 0.35%), Slavic (17.4%, a difference of 0.40%), Immigrants from Caribbean (17.4%, a difference of 0.47%), and Haitian (17.3%, a difference of 0.57%). Similarly, the demographic groups most similar to Immigrants from Zaire are Lithuanian (17.3%, a difference of 0.010%), Swiss (17.3%, a difference of 0.13%), Slovene (17.3%, a difference of 0.22%), Polish (17.3%, a difference of 0.22%), and Jamaican (17.3%, a difference of 0.27%).
| Demographics | Rating | Rank | Single Father Poverty |
| Immigrants | Haiti | 0.8 /100 | #256 | Tragic 17.2% |
| Immigrants | Albania | 0.7 /100 | #257 | Tragic 17.2% |
| Albanians | 0.7 /100 | #258 | Tragic 17.2% |
| Immigrants | Jamaica | 0.7 /100 | #259 | Tragic 17.2% |
| Spaniards | 0.6 /100 | #260 | Tragic 17.2% |
| Swiss | 0.5 /100 | #261 | Tragic 17.3% |
| Immigrants | Zaire | 0.4 /100 | #262 | Tragic 17.3% |
| Lithuanians | 0.4 /100 | #263 | Tragic 17.3% |
| Slovenes | 0.3 /100 | #264 | Tragic 17.3% |
| Poles | 0.3 /100 | #265 | Tragic 17.3% |
| Jamaicans | 0.3 /100 | #266 | Tragic 17.3% |
| Haitians | 0.3 /100 | #267 | Tragic 17.3% |
| Immigrants | Caribbean | 0.3 /100 | #268 | Tragic 17.4% |
| Slavs | 0.3 /100 | #269 | Tragic 17.4% |
| Indonesians | 0.2 /100 | #270 | Tragic 17.4% |
| French American Indians | 0.2 /100 | #271 | Tragic 17.4% |
| Barbadians | 0.1 /100 | #272 | Tragic 17.5% |
| Italians | 0.1 /100 | #273 | Tragic 17.5% |
| Macedonians | 0.1 /100 | #274 | Tragic 17.7% |
| British West Indians | 0.0 /100 | #275 | Tragic 17.7% |
| German Russians | 0.0 /100 | #276 | Tragic 17.7% |