Welsh vs Immigrants from Turkey Single Father Poverty
COMPARE
Welsh
Immigrants from Turkey
Single Father Poverty
Single Father Poverty Comparison
Welsh
Immigrants from Turkey
17.8%
SINGLE FATHER POVERTY
0.0/ 100
METRIC RATING
284th/ 347
METRIC RANK
15.3%
SINGLE FATHER POVERTY
99.5/ 100
METRIC RATING
75th/ 347
METRIC RANK
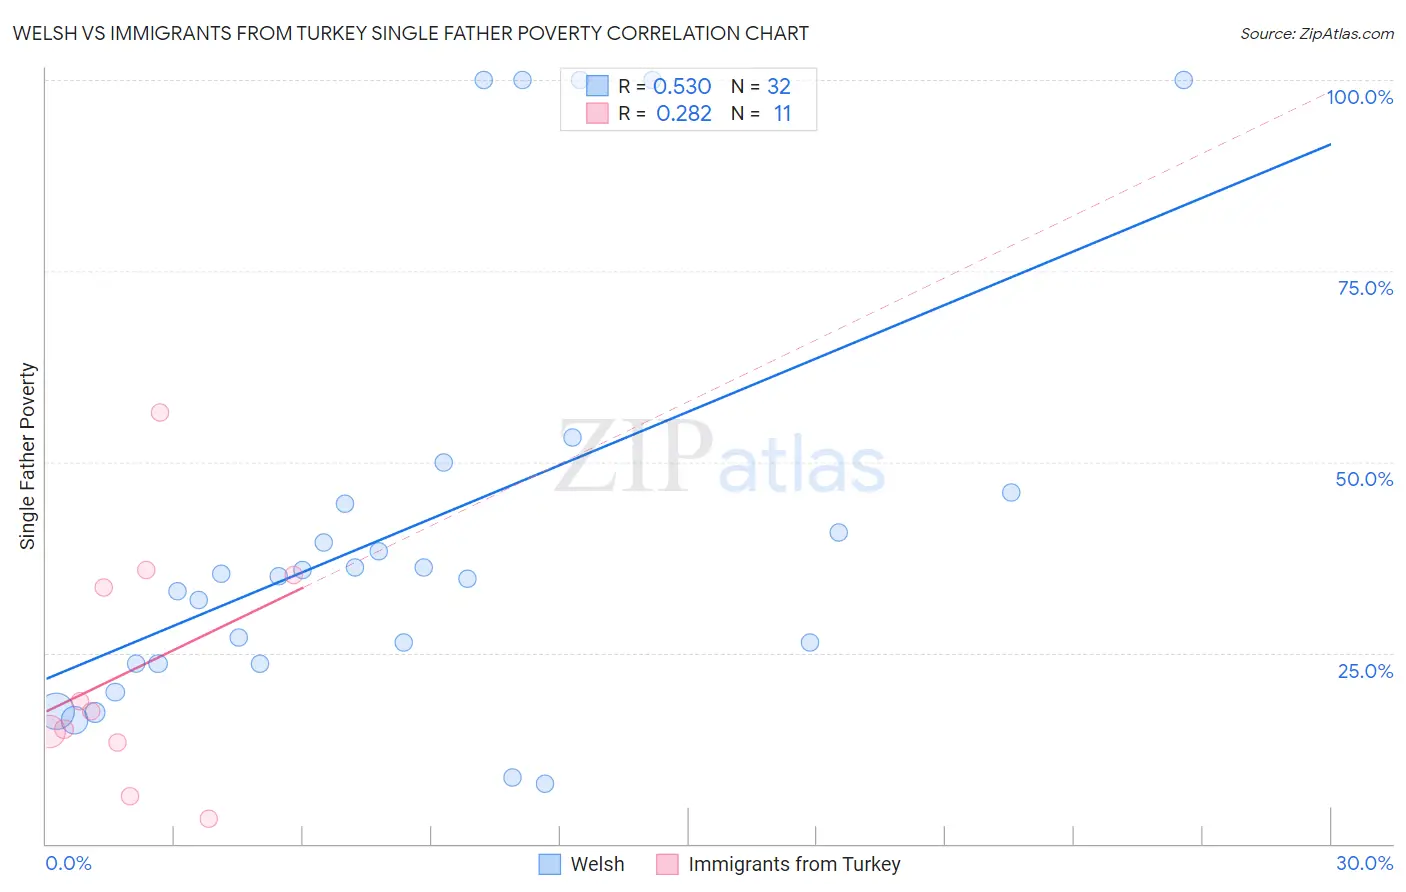
Welsh vs Immigrants from Turkey Single Father Poverty Correlation Chart
The statistical analysis conducted on geographies consisting of 385,351,851 people shows a substantial positive correlation between the proportion of Welsh and poverty level among single fathers in the United States with a correlation coefficient (R) of 0.530 and weighted average of 17.8%. Similarly, the statistical analysis conducted on geographies consisting of 182,600,036 people shows a weak positive correlation between the proportion of Immigrants from Turkey and poverty level among single fathers in the United States with a correlation coefficient (R) of 0.282 and weighted average of 15.3%, a difference of 16.3%.
Single Father Poverty Correlation Summary
| Measurement | Welsh | Immigrants from Turkey |
| Minimum | 7.8% | 3.3% |
| Maximum | 100.0% | 56.5% |
| Range | 92.2% | 53.2% |
| Mean | 41.5% | 22.7% |
| Median | 35.2% | 17.3% |
| Interquartile 25% (IQ1) | 23.6% | 13.3% |
| Interquartile 75% (IQ3) | 45.3% | 35.1% |
| Interquartile Range (IQR) | 21.7% | 21.8% |
| Standard Deviation (Sample) | 27.8% | 15.8% |
| Standard Deviation (Population) | 27.3% | 15.1% |
Similar Demographics by Single Father Poverty
Demographics Similar to Welsh by Single Father Poverty
In terms of single father poverty, the demographic groups most similar to Welsh are Alsatian (17.8%, a difference of 0.020%), Dutch (17.8%, a difference of 0.11%), English (17.8%, a difference of 0.12%), Immigrants from Lebanon (17.9%, a difference of 0.37%), and Scottish (17.7%, a difference of 0.43%).
| Demographics | Rating | Rank | Single Father Poverty |
| Lebanese | 0.0 /100 | #277 | Tragic 17.7% |
| Germans | 0.0 /100 | #278 | Tragic 17.7% |
| Iroquois | 0.0 /100 | #279 | Tragic 17.7% |
| Scottish | 0.0 /100 | #280 | Tragic 17.7% |
| English | 0.0 /100 | #281 | Tragic 17.8% |
| Dutch | 0.0 /100 | #282 | Tragic 17.8% |
| Alsatians | 0.0 /100 | #283 | Tragic 17.8% |
| Welsh | 0.0 /100 | #284 | Tragic 17.8% |
| Immigrants | Lebanon | 0.0 /100 | #285 | Tragic 17.9% |
| Immigrants | North Macedonia | 0.0 /100 | #286 | Tragic 17.9% |
| Carpatho Rusyns | 0.0 /100 | #287 | Tragic 18.0% |
| Bahamians | 0.0 /100 | #288 | Tragic 18.0% |
| Irish | 0.0 /100 | #289 | Tragic 18.0% |
| West Indians | 0.0 /100 | #290 | Tragic 18.0% |
| Alaskan Athabascans | 0.0 /100 | #291 | Tragic 18.1% |
Demographics Similar to Immigrants from Turkey by Single Father Poverty
In terms of single father poverty, the demographic groups most similar to Immigrants from Turkey are Maltese (15.3%, a difference of 0.020%), Kenyan (15.3%, a difference of 0.060%), Immigrants from Japan (15.3%, a difference of 0.080%), Immigrants from Peru (15.3%, a difference of 0.090%), and Tlingit-Haida (15.3%, a difference of 0.14%).
| Demographics | Rating | Rank | Single Father Poverty |
| Immigrants | Cameroon | 99.7 /100 | #68 | Exceptional 15.2% |
| Japanese | 99.7 /100 | #69 | Exceptional 15.2% |
| Mongolians | 99.7 /100 | #70 | Exceptional 15.3% |
| Immigrants | Brazil | 99.6 /100 | #71 | Exceptional 15.3% |
| Immigrants | Lithuania | 99.6 /100 | #72 | Exceptional 15.3% |
| Kenyans | 99.6 /100 | #73 | Exceptional 15.3% |
| Maltese | 99.6 /100 | #74 | Exceptional 15.3% |
| Immigrants | Turkey | 99.5 /100 | #75 | Exceptional 15.3% |
| Immigrants | Japan | 99.5 /100 | #76 | Exceptional 15.3% |
| Immigrants | Peru | 99.5 /100 | #77 | Exceptional 15.3% |
| Tlingit-Haida | 99.5 /100 | #78 | Exceptional 15.3% |
| Immigrants | Northern Africa | 99.5 /100 | #79 | Exceptional 15.3% |
| Armenians | 99.4 /100 | #80 | Exceptional 15.4% |
| Immigrants | Congo | 99.4 /100 | #81 | Exceptional 15.4% |
| Immigrants | Ukraine | 99.4 /100 | #82 | Exceptional 15.4% |