Estonian vs Immigrants from Zaire Single Father Poverty
COMPARE
Estonian
Immigrants from Zaire
Single Father Poverty
Single Father Poverty Comparison
Estonians
Immigrants from Zaire
16.2%
SINGLE FATHER POVERTY
56.7/ 100
METRIC RATING
161st/ 347
METRIC RANK
17.3%
SINGLE FATHER POVERTY
0.4/ 100
METRIC RATING
262nd/ 347
METRIC RANK
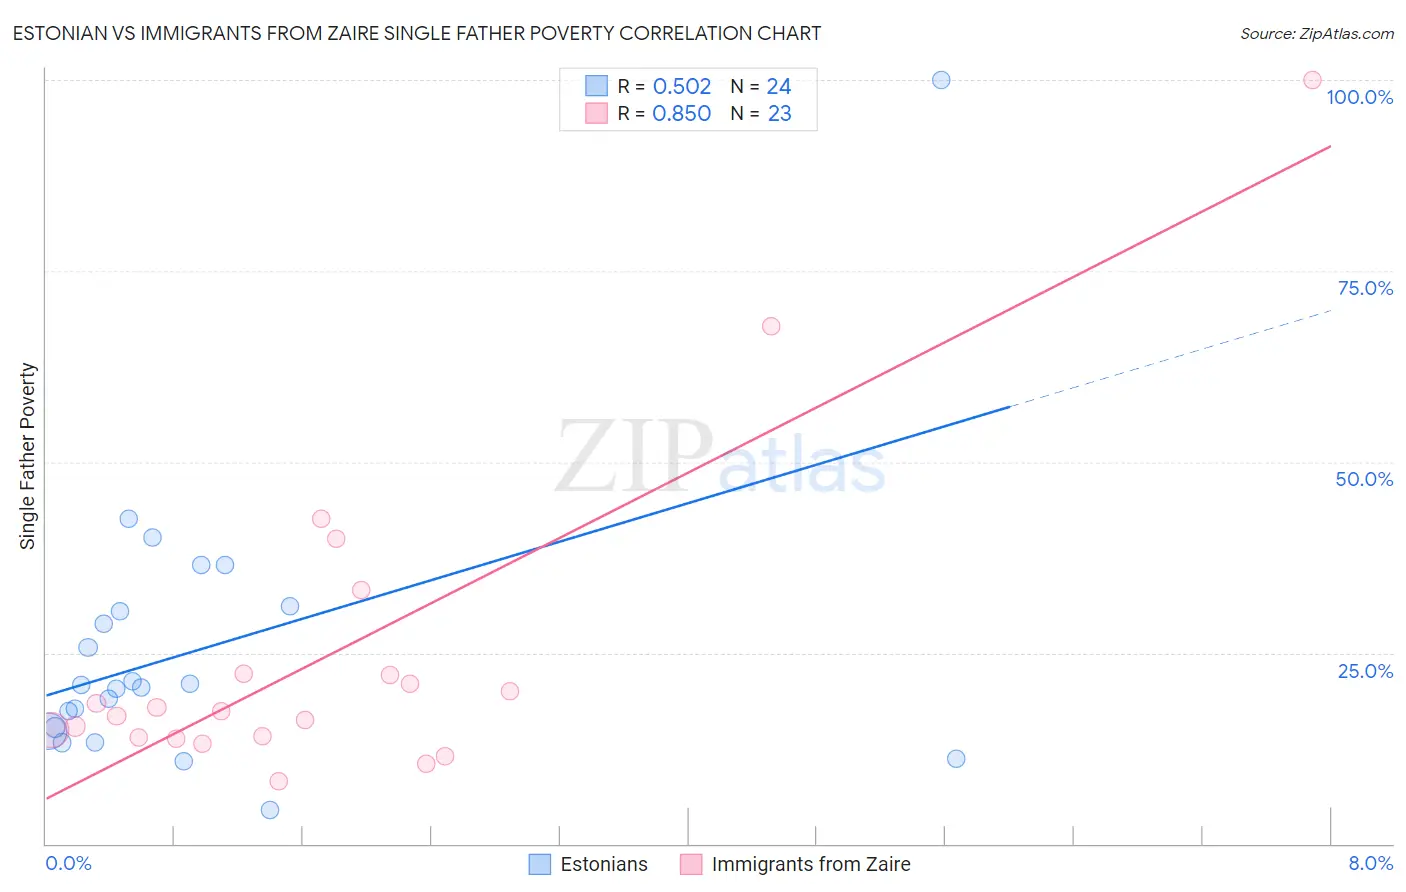
Estonian vs Immigrants from Zaire Single Father Poverty Correlation Chart
The statistical analysis conducted on geographies consisting of 107,284,896 people shows a substantial positive correlation between the proportion of Estonians and poverty level among single fathers in the United States with a correlation coefficient (R) of 0.502 and weighted average of 16.2%. Similarly, the statistical analysis conducted on geographies consisting of 97,955,340 people shows a very strong positive correlation between the proportion of Immigrants from Zaire and poverty level among single fathers in the United States with a correlation coefficient (R) of 0.850 and weighted average of 17.3%, a difference of 6.4%.
Single Father Poverty Correlation Summary
| Measurement | Estonian | Immigrants from Zaire |
| Minimum | 4.3% | 8.2% |
| Maximum | 100.0% | 100.0% |
| Range | 95.7% | 91.8% |
| Mean | 25.5% | 24.8% |
| Median | 20.6% | 17.3% |
| Interquartile 25% (IQ1) | 14.9% | 14.0% |
| Interquartile 75% (IQ3) | 30.7% | 22.3% |
| Interquartile Range (IQR) | 15.8% | 8.3% |
| Standard Deviation (Sample) | 18.7% | 21.1% |
| Standard Deviation (Population) | 18.3% | 20.6% |
Similar Demographics by Single Father Poverty
Demographics Similar to Estonians by Single Father Poverty
In terms of single father poverty, the demographic groups most similar to Estonians are Ugandan (16.3%, a difference of 0.040%), Immigrants from Costa Rica (16.3%, a difference of 0.040%), Guyanese (16.3%, a difference of 0.070%), Immigrants from Bangladesh (16.3%, a difference of 0.070%), and Immigrants from Europe (16.3%, a difference of 0.080%).
| Demographics | Rating | Rank | Single Father Poverty |
| Mexicans | 70.1 /100 | #154 | Good 16.1% |
| Immigrants | Nicaragua | 67.8 /100 | #155 | Good 16.2% |
| Immigrants | Jordan | 66.0 /100 | #156 | Good 16.2% |
| Immigrants | Czechoslovakia | 62.8 /100 | #157 | Good 16.2% |
| Portuguese | 62.3 /100 | #158 | Good 16.2% |
| Belizeans | 59.9 /100 | #159 | Average 16.2% |
| Immigrants | Sudan | 59.8 /100 | #160 | Average 16.2% |
| Estonians | 56.7 /100 | #161 | Average 16.2% |
| Ugandans | 55.9 /100 | #162 | Average 16.3% |
| Immigrants | Costa Rica | 55.7 /100 | #163 | Average 16.3% |
| Guyanese | 55.2 /100 | #164 | Average 16.3% |
| Immigrants | Bangladesh | 55.1 /100 | #165 | Average 16.3% |
| Immigrants | Europe | 54.8 /100 | #166 | Average 16.3% |
| Yugoslavians | 53.9 /100 | #167 | Average 16.3% |
| Costa Ricans | 53.6 /100 | #168 | Average 16.3% |
Demographics Similar to Immigrants from Zaire by Single Father Poverty
In terms of single father poverty, the demographic groups most similar to Immigrants from Zaire are Lithuanian (17.3%, a difference of 0.010%), Swiss (17.3%, a difference of 0.13%), Slovene (17.3%, a difference of 0.22%), Polish (17.3%, a difference of 0.22%), and Jamaican (17.3%, a difference of 0.27%).
| Demographics | Rating | Rank | Single Father Poverty |
| Sierra Leoneans | 0.8 /100 | #255 | Tragic 17.2% |
| Immigrants | Haiti | 0.8 /100 | #256 | Tragic 17.2% |
| Immigrants | Albania | 0.7 /100 | #257 | Tragic 17.2% |
| Albanians | 0.7 /100 | #258 | Tragic 17.2% |
| Immigrants | Jamaica | 0.7 /100 | #259 | Tragic 17.2% |
| Spaniards | 0.6 /100 | #260 | Tragic 17.2% |
| Swiss | 0.5 /100 | #261 | Tragic 17.3% |
| Immigrants | Zaire | 0.4 /100 | #262 | Tragic 17.3% |
| Lithuanians | 0.4 /100 | #263 | Tragic 17.3% |
| Slovenes | 0.3 /100 | #264 | Tragic 17.3% |
| Poles | 0.3 /100 | #265 | Tragic 17.3% |
| Jamaicans | 0.3 /100 | #266 | Tragic 17.3% |
| Haitians | 0.3 /100 | #267 | Tragic 17.3% |
| Immigrants | Caribbean | 0.3 /100 | #268 | Tragic 17.4% |
| Slavs | 0.3 /100 | #269 | Tragic 17.4% |