Welsh vs Jordanian Single Father Poverty
COMPARE
Welsh
Jordanian
Single Father Poverty
Single Father Poverty Comparison
Welsh
Jordanians
17.8%
SINGLE FATHER POVERTY
0.0/ 100
METRIC RATING
284th/ 347
METRIC RANK
16.1%
SINGLE FATHER POVERTY
74.2/ 100
METRIC RATING
150th/ 347
METRIC RANK
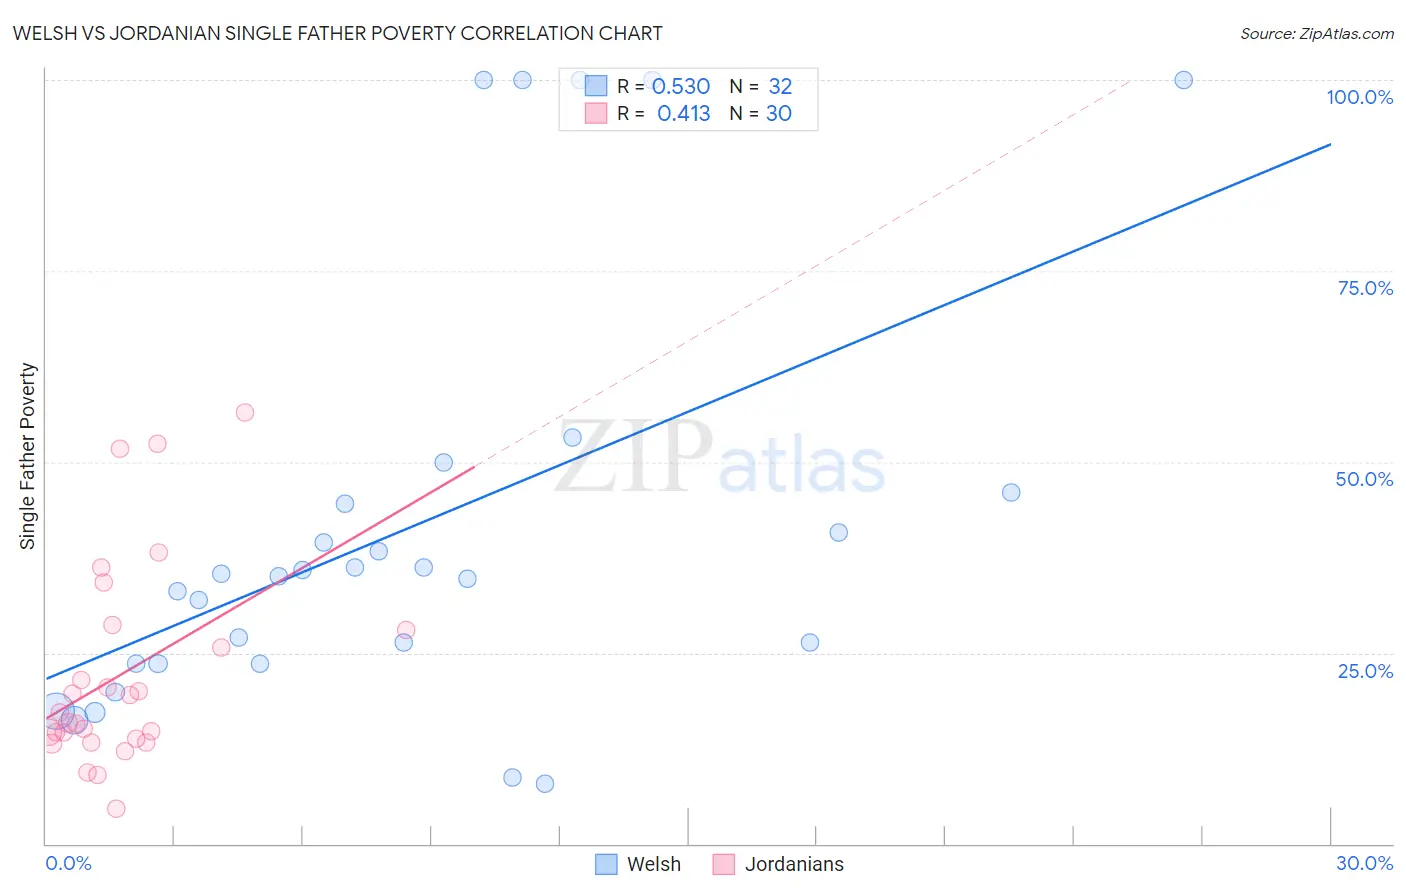
Welsh vs Jordanian Single Father Poverty Correlation Chart
The statistical analysis conducted on geographies consisting of 385,351,851 people shows a substantial positive correlation between the proportion of Welsh and poverty level among single fathers in the United States with a correlation coefficient (R) of 0.530 and weighted average of 17.8%. Similarly, the statistical analysis conducted on geographies consisting of 144,384,155 people shows a moderate positive correlation between the proportion of Jordanians and poverty level among single fathers in the United States with a correlation coefficient (R) of 0.413 and weighted average of 16.1%, a difference of 10.7%.
Single Father Poverty Correlation Summary
| Measurement | Welsh | Jordanian |
| Minimum | 7.8% | 4.6% |
| Maximum | 100.0% | 56.5% |
| Range | 92.2% | 51.9% |
| Mean | 41.5% | 22.1% |
| Median | 35.2% | 16.5% |
| Interquartile 25% (IQ1) | 23.6% | 13.8% |
| Interquartile 75% (IQ3) | 45.3% | 28.0% |
| Interquartile Range (IQR) | 21.7% | 14.2% |
| Standard Deviation (Sample) | 27.8% | 13.3% |
| Standard Deviation (Population) | 27.3% | 13.1% |
Similar Demographics by Single Father Poverty
Demographics Similar to Welsh by Single Father Poverty
In terms of single father poverty, the demographic groups most similar to Welsh are Alsatian (17.8%, a difference of 0.020%), Dutch (17.8%, a difference of 0.11%), English (17.8%, a difference of 0.12%), Immigrants from Lebanon (17.9%, a difference of 0.37%), and Scottish (17.7%, a difference of 0.43%).
| Demographics | Rating | Rank | Single Father Poverty |
| Lebanese | 0.0 /100 | #277 | Tragic 17.7% |
| Germans | 0.0 /100 | #278 | Tragic 17.7% |
| Iroquois | 0.0 /100 | #279 | Tragic 17.7% |
| Scottish | 0.0 /100 | #280 | Tragic 17.7% |
| English | 0.0 /100 | #281 | Tragic 17.8% |
| Dutch | 0.0 /100 | #282 | Tragic 17.8% |
| Alsatians | 0.0 /100 | #283 | Tragic 17.8% |
| Welsh | 0.0 /100 | #284 | Tragic 17.8% |
| Immigrants | Lebanon | 0.0 /100 | #285 | Tragic 17.9% |
| Immigrants | North Macedonia | 0.0 /100 | #286 | Tragic 17.9% |
| Carpatho Rusyns | 0.0 /100 | #287 | Tragic 18.0% |
| Bahamians | 0.0 /100 | #288 | Tragic 18.0% |
| Irish | 0.0 /100 | #289 | Tragic 18.0% |
| West Indians | 0.0 /100 | #290 | Tragic 18.0% |
| Alaskan Athabascans | 0.0 /100 | #291 | Tragic 18.1% |
Demographics Similar to Jordanians by Single Father Poverty
In terms of single father poverty, the demographic groups most similar to Jordanians are South African (16.1%, a difference of 0.060%), Immigrants from France (16.1%, a difference of 0.060%), Immigrants from Zimbabwe (16.1%, a difference of 0.12%), Immigrants from Israel (16.1%, a difference of 0.13%), and Nigerian (16.1%, a difference of 0.16%).
| Demographics | Rating | Rank | Single Father Poverty |
| Immigrants | Central America | 83.1 /100 | #143 | Excellent 16.0% |
| Immigrants | Kuwait | 81.4 /100 | #144 | Excellent 16.0% |
| Immigrants | Western Asia | 80.7 /100 | #145 | Excellent 16.0% |
| Immigrants | Hungary | 78.3 /100 | #146 | Good 16.1% |
| Colombians | 77.1 /100 | #147 | Good 16.1% |
| Nigerians | 76.8 /100 | #148 | Good 16.1% |
| South Africans | 75.1 /100 | #149 | Good 16.1% |
| Jordanians | 74.2 /100 | #150 | Good 16.1% |
| Immigrants | France | 73.1 /100 | #151 | Good 16.1% |
| Immigrants | Zimbabwe | 72.1 /100 | #152 | Good 16.1% |
| Immigrants | Israel | 72.0 /100 | #153 | Good 16.1% |
| Mexicans | 70.1 /100 | #154 | Good 16.1% |
| Immigrants | Nicaragua | 67.8 /100 | #155 | Good 16.2% |
| Immigrants | Jordan | 66.0 /100 | #156 | Good 16.2% |
| Immigrants | Czechoslovakia | 62.8 /100 | #157 | Good 16.2% |