Welsh vs Immigrants from Ireland Single Father Poverty
COMPARE
Welsh
Immigrants from Ireland
Single Father Poverty
Single Father Poverty Comparison
Welsh
Immigrants from Ireland
17.8%
SINGLE FATHER POVERTY
0.0/ 100
METRIC RATING
284th/ 347
METRIC RANK
17.1%
SINGLE FATHER POVERTY
1.4/ 100
METRIC RATING
246th/ 347
METRIC RANK
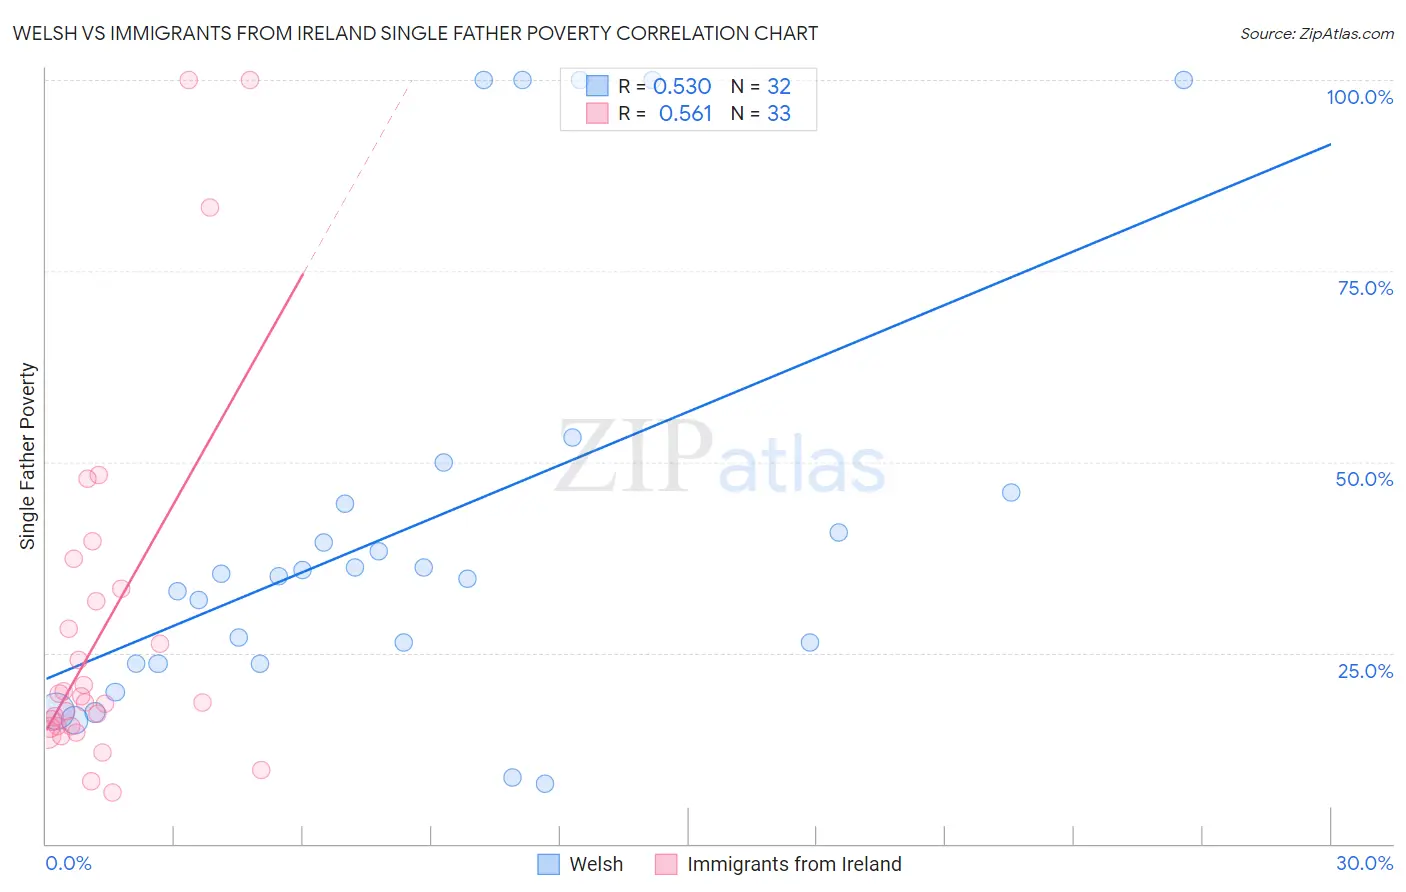
Welsh vs Immigrants from Ireland Single Father Poverty Correlation Chart
The statistical analysis conducted on geographies consisting of 385,351,851 people shows a substantial positive correlation between the proportion of Welsh and poverty level among single fathers in the United States with a correlation coefficient (R) of 0.530 and weighted average of 17.8%. Similarly, the statistical analysis conducted on geographies consisting of 193,149,664 people shows a substantial positive correlation between the proportion of Immigrants from Ireland and poverty level among single fathers in the United States with a correlation coefficient (R) of 0.561 and weighted average of 17.1%, a difference of 4.5%.
Single Father Poverty Correlation Summary
| Measurement | Welsh | Immigrants from Ireland |
| Minimum | 7.8% | 6.7% |
| Maximum | 100.0% | 100.0% |
| Range | 92.2% | 93.3% |
| Mean | 41.5% | 28.1% |
| Median | 35.2% | 18.5% |
| Interquartile 25% (IQ1) | 23.6% | 15.3% |
| Interquartile 75% (IQ3) | 45.3% | 32.6% |
| Interquartile Range (IQR) | 21.7% | 17.3% |
| Standard Deviation (Sample) | 27.8% | 23.7% |
| Standard Deviation (Population) | 27.3% | 23.4% |
Similar Demographics by Single Father Poverty
Demographics Similar to Welsh by Single Father Poverty
In terms of single father poverty, the demographic groups most similar to Welsh are Alsatian (17.8%, a difference of 0.020%), Dutch (17.8%, a difference of 0.11%), English (17.8%, a difference of 0.12%), Immigrants from Lebanon (17.9%, a difference of 0.37%), and Scottish (17.7%, a difference of 0.43%).
| Demographics | Rating | Rank | Single Father Poverty |
| Lebanese | 0.0 /100 | #277 | Tragic 17.7% |
| Germans | 0.0 /100 | #278 | Tragic 17.7% |
| Iroquois | 0.0 /100 | #279 | Tragic 17.7% |
| Scottish | 0.0 /100 | #280 | Tragic 17.7% |
| English | 0.0 /100 | #281 | Tragic 17.8% |
| Dutch | 0.0 /100 | #282 | Tragic 17.8% |
| Alsatians | 0.0 /100 | #283 | Tragic 17.8% |
| Welsh | 0.0 /100 | #284 | Tragic 17.8% |
| Immigrants | Lebanon | 0.0 /100 | #285 | Tragic 17.9% |
| Immigrants | North Macedonia | 0.0 /100 | #286 | Tragic 17.9% |
| Carpatho Rusyns | 0.0 /100 | #287 | Tragic 18.0% |
| Bahamians | 0.0 /100 | #288 | Tragic 18.0% |
| Irish | 0.0 /100 | #289 | Tragic 18.0% |
| West Indians | 0.0 /100 | #290 | Tragic 18.0% |
| Alaskan Athabascans | 0.0 /100 | #291 | Tragic 18.1% |
Demographics Similar to Immigrants from Ireland by Single Father Poverty
In terms of single father poverty, the demographic groups most similar to Immigrants from Ireland are Trinidadian and Tobagonian (17.0%, a difference of 0.040%), Honduran (17.0%, a difference of 0.080%), Immigrants from Cabo Verde (17.0%, a difference of 0.10%), Greek (17.1%, a difference of 0.10%), and Czechoslovakian (17.1%, a difference of 0.10%).
| Demographics | Rating | Rank | Single Father Poverty |
| Bermudans | 2.6 /100 | #239 | Tragic 16.9% |
| Finns | 2.6 /100 | #240 | Tragic 16.9% |
| Czechs | 2.3 /100 | #241 | Tragic 17.0% |
| Moroccans | 2.1 /100 | #242 | Tragic 17.0% |
| Immigrants | Cabo Verde | 1.6 /100 | #243 | Tragic 17.0% |
| Hondurans | 1.6 /100 | #244 | Tragic 17.0% |
| Trinidadians and Tobagonians | 1.5 /100 | #245 | Tragic 17.0% |
| Immigrants | Ireland | 1.4 /100 | #246 | Tragic 17.1% |
| Greeks | 1.3 /100 | #247 | Tragic 17.1% |
| Czechoslovakians | 1.3 /100 | #248 | Tragic 17.1% |
| Canadians | 1.3 /100 | #249 | Tragic 17.1% |
| Austrians | 1.1 /100 | #250 | Tragic 17.1% |
| Luxembourgers | 1.1 /100 | #251 | Tragic 17.1% |
| Croatians | 1.0 /100 | #252 | Tragic 17.1% |
| Cree | 1.0 /100 | #253 | Tragic 17.1% |