Welsh vs Immigrants from Spain Single Father Poverty
COMPARE
Welsh
Immigrants from Spain
Single Father Poverty
Single Father Poverty Comparison
Welsh
Immigrants from Spain
17.8%
SINGLE FATHER POVERTY
0.0/ 100
METRIC RATING
284th/ 347
METRIC RANK
16.7%
SINGLE FATHER POVERTY
8.0/ 100
METRIC RATING
222nd/ 347
METRIC RANK
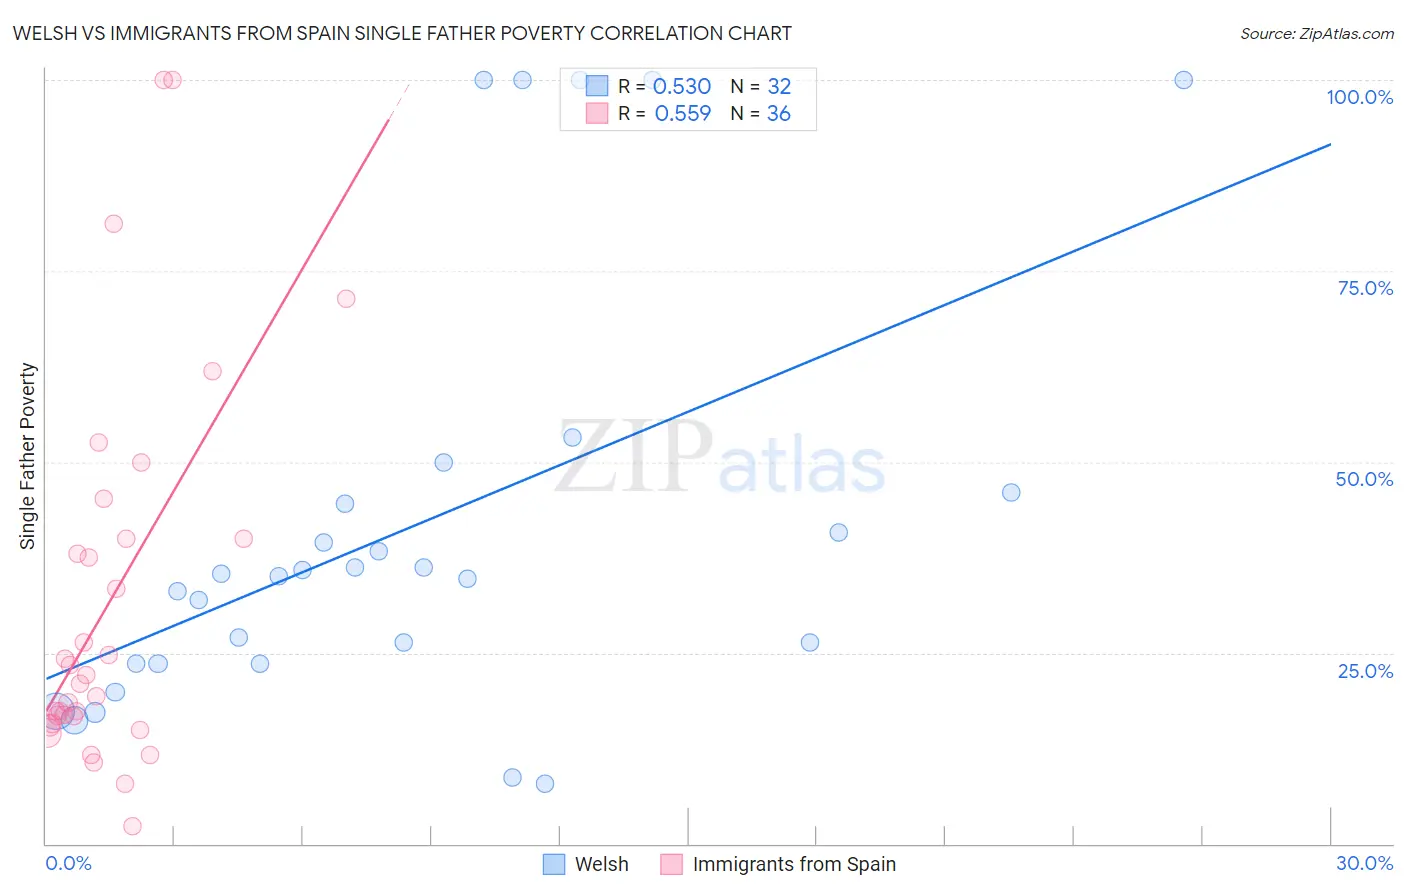
Welsh vs Immigrants from Spain Single Father Poverty Correlation Chart
The statistical analysis conducted on geographies consisting of 385,351,851 people shows a substantial positive correlation between the proportion of Welsh and poverty level among single fathers in the United States with a correlation coefficient (R) of 0.530 and weighted average of 17.8%. Similarly, the statistical analysis conducted on geographies consisting of 200,148,614 people shows a substantial positive correlation between the proportion of Immigrants from Spain and poverty level among single fathers in the United States with a correlation coefficient (R) of 0.559 and weighted average of 16.7%, a difference of 6.5%.
Single Father Poverty Correlation Summary
| Measurement | Welsh | Immigrants from Spain |
| Minimum | 7.8% | 2.2% |
| Maximum | 100.0% | 100.0% |
| Range | 92.2% | 97.8% |
| Mean | 41.5% | 31.6% |
| Median | 35.2% | 21.5% |
| Interquartile 25% (IQ1) | 23.6% | 16.2% |
| Interquartile 75% (IQ3) | 45.3% | 40.0% |
| Interquartile Range (IQR) | 21.7% | 23.8% |
| Standard Deviation (Sample) | 27.8% | 24.6% |
| Standard Deviation (Population) | 27.3% | 24.3% |
Similar Demographics by Single Father Poverty
Demographics Similar to Welsh by Single Father Poverty
In terms of single father poverty, the demographic groups most similar to Welsh are Alsatian (17.8%, a difference of 0.020%), Dutch (17.8%, a difference of 0.11%), English (17.8%, a difference of 0.12%), Immigrants from Lebanon (17.9%, a difference of 0.37%), and Scottish (17.7%, a difference of 0.43%).
| Demographics | Rating | Rank | Single Father Poverty |
| Lebanese | 0.0 /100 | #277 | Tragic 17.7% |
| Germans | 0.0 /100 | #278 | Tragic 17.7% |
| Iroquois | 0.0 /100 | #279 | Tragic 17.7% |
| Scottish | 0.0 /100 | #280 | Tragic 17.7% |
| English | 0.0 /100 | #281 | Tragic 17.8% |
| Dutch | 0.0 /100 | #282 | Tragic 17.8% |
| Alsatians | 0.0 /100 | #283 | Tragic 17.8% |
| Welsh | 0.0 /100 | #284 | Tragic 17.8% |
| Immigrants | Lebanon | 0.0 /100 | #285 | Tragic 17.9% |
| Immigrants | North Macedonia | 0.0 /100 | #286 | Tragic 17.9% |
| Carpatho Rusyns | 0.0 /100 | #287 | Tragic 18.0% |
| Bahamians | 0.0 /100 | #288 | Tragic 18.0% |
| Irish | 0.0 /100 | #289 | Tragic 18.0% |
| West Indians | 0.0 /100 | #290 | Tragic 18.0% |
| Alaskan Athabascans | 0.0 /100 | #291 | Tragic 18.1% |
Demographics Similar to Immigrants from Spain by Single Father Poverty
In terms of single father poverty, the demographic groups most similar to Immigrants from Spain are Immigrants from Denmark (16.7%, a difference of 0.010%), Immigrants from Greece (16.7%, a difference of 0.010%), Immigrants from Ghana (16.7%, a difference of 0.020%), Immigrants from Uganda (16.7%, a difference of 0.070%), and Immigrants from Austria (16.8%, a difference of 0.16%).
| Demographics | Rating | Rank | Single Father Poverty |
| Immigrants | Scotland | 9.6 /100 | #215 | Tragic 16.7% |
| Immigrants | England | 9.5 /100 | #216 | Tragic 16.7% |
| Cheyenne | 9.3 /100 | #217 | Tragic 16.7% |
| Immigrants | Uganda | 8.6 /100 | #218 | Tragic 16.7% |
| Immigrants | Ghana | 8.1 /100 | #219 | Tragic 16.7% |
| Immigrants | Denmark | 8.1 /100 | #220 | Tragic 16.7% |
| Immigrants | Greece | 8.1 /100 | #221 | Tragic 16.7% |
| Immigrants | Spain | 8.0 /100 | #222 | Tragic 16.7% |
| Immigrants | Austria | 7.0 /100 | #223 | Tragic 16.8% |
| Immigrants | Norway | 6.5 /100 | #224 | Tragic 16.8% |
| Menominee | 6.4 /100 | #225 | Tragic 16.8% |
| Hispanics or Latinos | 6.1 /100 | #226 | Tragic 16.8% |
| British | 5.6 /100 | #227 | Tragic 16.8% |
| Belgians | 5.3 /100 | #228 | Tragic 16.8% |
| Israelis | 4.6 /100 | #229 | Tragic 16.8% |