Welsh vs Cuban Single Father Poverty
COMPARE
Welsh
Cuban
Single Father Poverty
Single Father Poverty Comparison
Welsh
Cubans
17.8%
SINGLE FATHER POVERTY
0.0/ 100
METRIC RATING
284th/ 347
METRIC RANK
16.6%
SINGLE FATHER POVERTY
16.5/ 100
METRIC RATING
201st/ 347
METRIC RANK
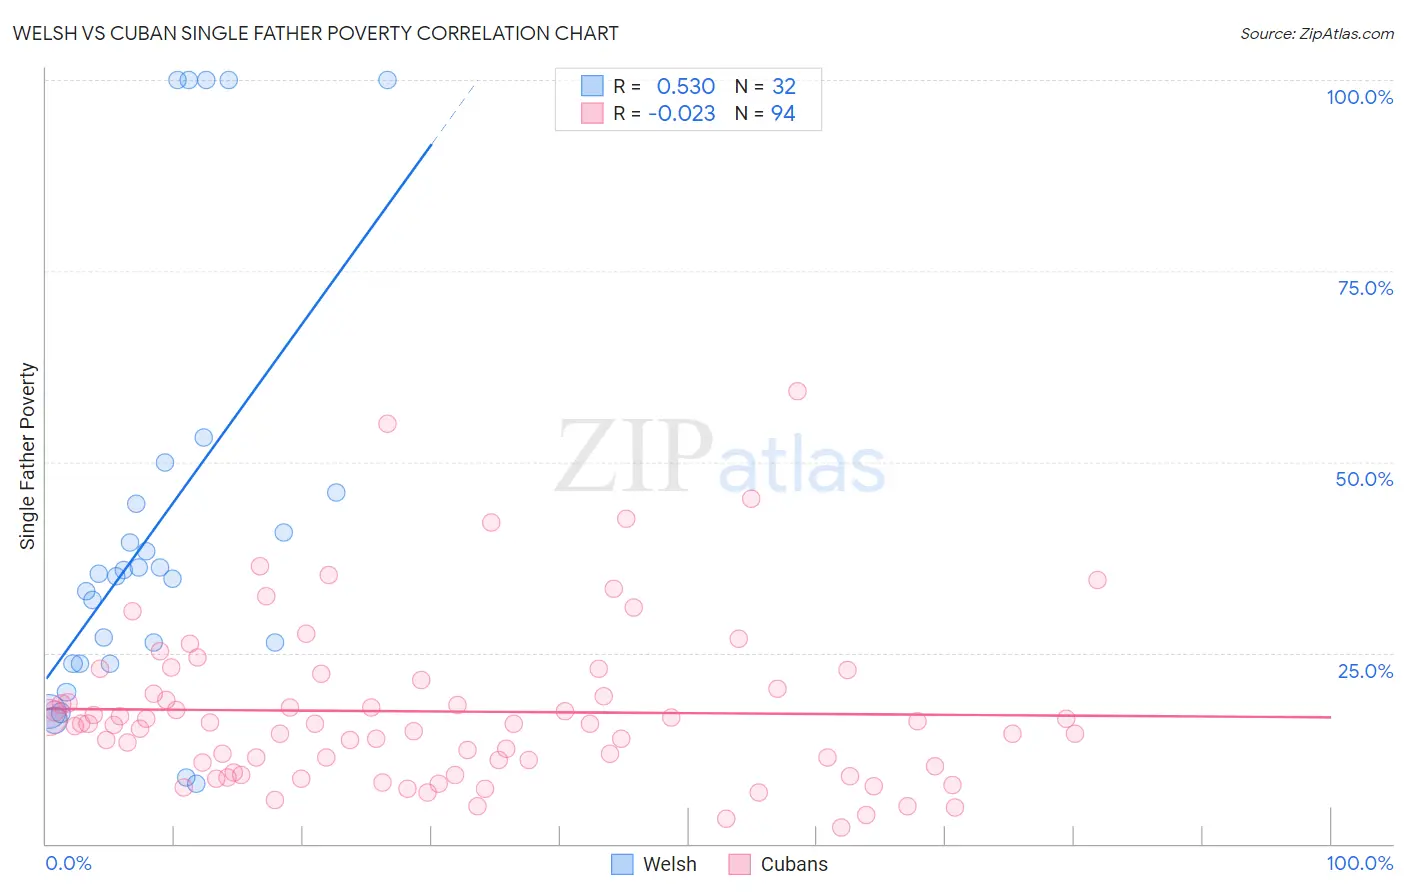
Welsh vs Cuban Single Father Poverty Correlation Chart
The statistical analysis conducted on geographies consisting of 385,351,851 people shows a substantial positive correlation between the proportion of Welsh and poverty level among single fathers in the United States with a correlation coefficient (R) of 0.530 and weighted average of 17.8%. Similarly, the statistical analysis conducted on geographies consisting of 350,103,033 people shows no correlation between the proportion of Cubans and poverty level among single fathers in the United States with a correlation coefficient (R) of -0.023 and weighted average of 16.6%, a difference of 7.4%.
Single Father Poverty Correlation Summary
| Measurement | Welsh | Cuban |
| Minimum | 7.8% | 2.1% |
| Maximum | 100.0% | 59.3% |
| Range | 92.2% | 57.2% |
| Mean | 41.5% | 17.3% |
| Median | 35.2% | 15.6% |
| Interquartile 25% (IQ1) | 23.6% | 10.1% |
| Interquartile 75% (IQ3) | 45.3% | 20.3% |
| Interquartile Range (IQR) | 21.7% | 10.2% |
| Standard Deviation (Sample) | 27.8% | 10.7% |
| Standard Deviation (Population) | 27.3% | 10.7% |
Similar Demographics by Single Father Poverty
Demographics Similar to Welsh by Single Father Poverty
In terms of single father poverty, the demographic groups most similar to Welsh are Alsatian (17.8%, a difference of 0.020%), Dutch (17.8%, a difference of 0.11%), English (17.8%, a difference of 0.12%), Immigrants from Lebanon (17.9%, a difference of 0.37%), and Scottish (17.7%, a difference of 0.43%).
| Demographics | Rating | Rank | Single Father Poverty |
| Lebanese | 0.0 /100 | #277 | Tragic 17.7% |
| Germans | 0.0 /100 | #278 | Tragic 17.7% |
| Iroquois | 0.0 /100 | #279 | Tragic 17.7% |
| Scottish | 0.0 /100 | #280 | Tragic 17.7% |
| English | 0.0 /100 | #281 | Tragic 17.8% |
| Dutch | 0.0 /100 | #282 | Tragic 17.8% |
| Alsatians | 0.0 /100 | #283 | Tragic 17.8% |
| Welsh | 0.0 /100 | #284 | Tragic 17.8% |
| Immigrants | Lebanon | 0.0 /100 | #285 | Tragic 17.9% |
| Immigrants | North Macedonia | 0.0 /100 | #286 | Tragic 17.9% |
| Carpatho Rusyns | 0.0 /100 | #287 | Tragic 18.0% |
| Bahamians | 0.0 /100 | #288 | Tragic 18.0% |
| Irish | 0.0 /100 | #289 | Tragic 18.0% |
| West Indians | 0.0 /100 | #290 | Tragic 18.0% |
| Alaskan Athabascans | 0.0 /100 | #291 | Tragic 18.1% |
Demographics Similar to Cubans by Single Father Poverty
In terms of single father poverty, the demographic groups most similar to Cubans are Immigrants from Croatia (16.6%, a difference of 0.0%), Syrian (16.6%, a difference of 0.070%), Immigrants from North America (16.6%, a difference of 0.12%), Immigrants from Guatemala (16.6%, a difference of 0.15%), and Venezuelan (16.6%, a difference of 0.19%).
| Demographics | Rating | Rank | Single Father Poverty |
| Cape Verdeans | 24.4 /100 | #194 | Fair 16.5% |
| Immigrants | Barbados | 24.3 /100 | #195 | Fair 16.5% |
| Immigrants | Canada | 21.9 /100 | #196 | Fair 16.5% |
| Immigrants | Northern Europe | 20.3 /100 | #197 | Fair 16.5% |
| Romanians | 20.1 /100 | #198 | Fair 16.5% |
| Immigrants | Belize | 19.8 /100 | #199 | Poor 16.5% |
| Syrians | 17.4 /100 | #200 | Poor 16.6% |
| Cubans | 16.5 /100 | #201 | Poor 16.6% |
| Immigrants | Croatia | 16.5 /100 | #202 | Poor 16.6% |
| Immigrants | North America | 15.1 /100 | #203 | Poor 16.6% |
| Immigrants | Guatemala | 14.8 /100 | #204 | Poor 16.6% |
| Venezuelans | 14.3 /100 | #205 | Poor 16.6% |
| Immigrants | Senegal | 13.7 /100 | #206 | Poor 16.6% |
| New Zealanders | 13.7 /100 | #207 | Poor 16.6% |
| Eastern Europeans | 13.7 /100 | #208 | Poor 16.6% |