Welsh vs Ecuadorian Single Father Poverty
COMPARE
Welsh
Ecuadorian
Single Father Poverty
Single Father Poverty Comparison
Welsh
Ecuadorians
17.8%
SINGLE FATHER POVERTY
0.0/ 100
METRIC RATING
284th/ 347
METRIC RANK
16.5%
SINGLE FATHER POVERTY
24.5/ 100
METRIC RATING
193rd/ 347
METRIC RANK
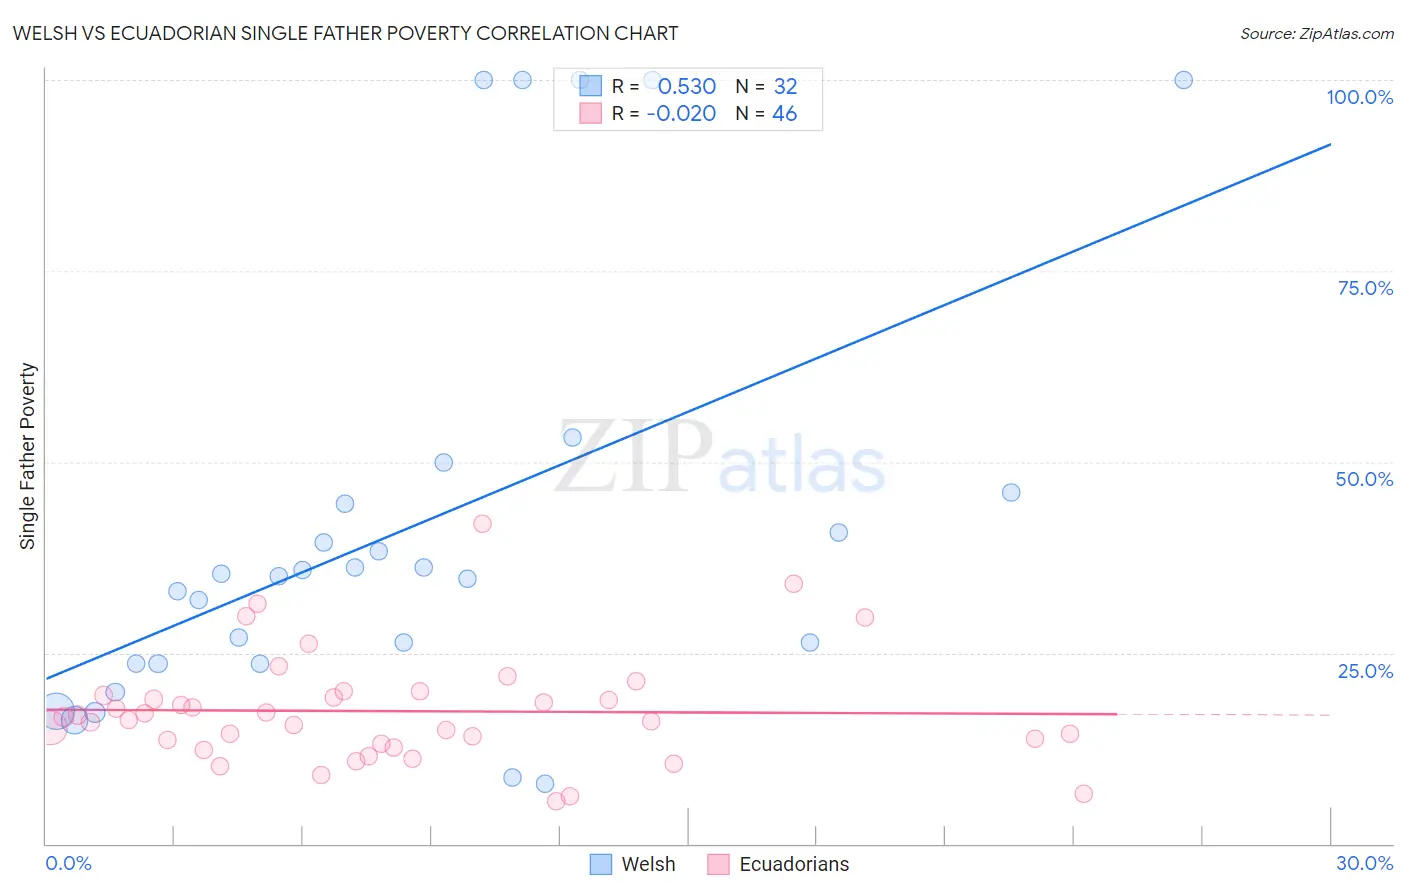
Welsh vs Ecuadorian Single Father Poverty Correlation Chart
The statistical analysis conducted on geographies consisting of 385,351,851 people shows a substantial positive correlation between the proportion of Welsh and poverty level among single fathers in the United States with a correlation coefficient (R) of 0.530 and weighted average of 17.8%. Similarly, the statistical analysis conducted on geographies consisting of 258,169,372 people shows no correlation between the proportion of Ecuadorians and poverty level among single fathers in the United States with a correlation coefficient (R) of -0.020 and weighted average of 16.5%, a difference of 8.0%.
Single Father Poverty Correlation Summary
| Measurement | Welsh | Ecuadorian |
| Minimum | 7.8% | 5.6% |
| Maximum | 100.0% | 41.9% |
| Range | 92.2% | 36.3% |
| Mean | 41.5% | 17.4% |
| Median | 35.2% | 16.4% |
| Interquartile 25% (IQ1) | 23.6% | 13.2% |
| Interquartile 75% (IQ3) | 45.3% | 19.4% |
| Interquartile Range (IQR) | 21.7% | 6.2% |
| Standard Deviation (Sample) | 27.8% | 7.2% |
| Standard Deviation (Population) | 27.3% | 7.2% |
Similar Demographics by Single Father Poverty
Demographics Similar to Welsh by Single Father Poverty
In terms of single father poverty, the demographic groups most similar to Welsh are Alsatian (17.8%, a difference of 0.020%), Dutch (17.8%, a difference of 0.11%), English (17.8%, a difference of 0.12%), Immigrants from Lebanon (17.9%, a difference of 0.37%), and Scottish (17.7%, a difference of 0.43%).
| Demographics | Rating | Rank | Single Father Poverty |
| Lebanese | 0.0 /100 | #277 | Tragic 17.7% |
| Germans | 0.0 /100 | #278 | Tragic 17.7% |
| Iroquois | 0.0 /100 | #279 | Tragic 17.7% |
| Scottish | 0.0 /100 | #280 | Tragic 17.7% |
| English | 0.0 /100 | #281 | Tragic 17.8% |
| Dutch | 0.0 /100 | #282 | Tragic 17.8% |
| Alsatians | 0.0 /100 | #283 | Tragic 17.8% |
| Welsh | 0.0 /100 | #284 | Tragic 17.8% |
| Immigrants | Lebanon | 0.0 /100 | #285 | Tragic 17.9% |
| Immigrants | North Macedonia | 0.0 /100 | #286 | Tragic 17.9% |
| Carpatho Rusyns | 0.0 /100 | #287 | Tragic 18.0% |
| Bahamians | 0.0 /100 | #288 | Tragic 18.0% |
| Irish | 0.0 /100 | #289 | Tragic 18.0% |
| West Indians | 0.0 /100 | #290 | Tragic 18.0% |
| Alaskan Athabascans | 0.0 /100 | #291 | Tragic 18.1% |
Demographics Similar to Ecuadorians by Single Father Poverty
In terms of single father poverty, the demographic groups most similar to Ecuadorians are Immigrants from Switzerland (16.5%, a difference of 0.010%), Cape Verdean (16.5%, a difference of 0.010%), Immigrants from Barbados (16.5%, a difference of 0.010%), Immigrants from Guyana (16.5%, a difference of 0.15%), and Immigrants from Canada (16.5%, a difference of 0.16%).
| Demographics | Rating | Rank | Single Father Poverty |
| Immigrants | Venezuela | 31.0 /100 | #186 | Fair 16.4% |
| Ukrainians | 30.4 /100 | #187 | Fair 16.4% |
| Russians | 30.1 /100 | #188 | Fair 16.4% |
| Latvians | 28.9 /100 | #189 | Fair 16.5% |
| Immigrants | Burma/Myanmar | 28.0 /100 | #190 | Fair 16.5% |
| Immigrants | Guyana | 27.1 /100 | #191 | Fair 16.5% |
| Immigrants | Switzerland | 24.8 /100 | #192 | Fair 16.5% |
| Ecuadorians | 24.5 /100 | #193 | Fair 16.5% |
| Cape Verdeans | 24.4 /100 | #194 | Fair 16.5% |
| Immigrants | Barbados | 24.3 /100 | #195 | Fair 16.5% |
| Immigrants | Canada | 21.9 /100 | #196 | Fair 16.5% |
| Immigrants | Northern Europe | 20.3 /100 | #197 | Fair 16.5% |
| Romanians | 20.1 /100 | #198 | Fair 16.5% |
| Immigrants | Belize | 19.8 /100 | #199 | Poor 16.5% |
| Syrians | 17.4 /100 | #200 | Poor 16.6% |