Welsh vs Immigrants Single Father Poverty
COMPARE
Welsh
Immigrants
Single Father Poverty
Single Father Poverty Comparison
Welsh
Immigrants
17.8%
SINGLE FATHER POVERTY
0.0/ 100
METRIC RATING
284th/ 347
METRIC RANK
15.9%
SINGLE FATHER POVERTY
91.9/ 100
METRIC RATING
121st/ 347
METRIC RANK
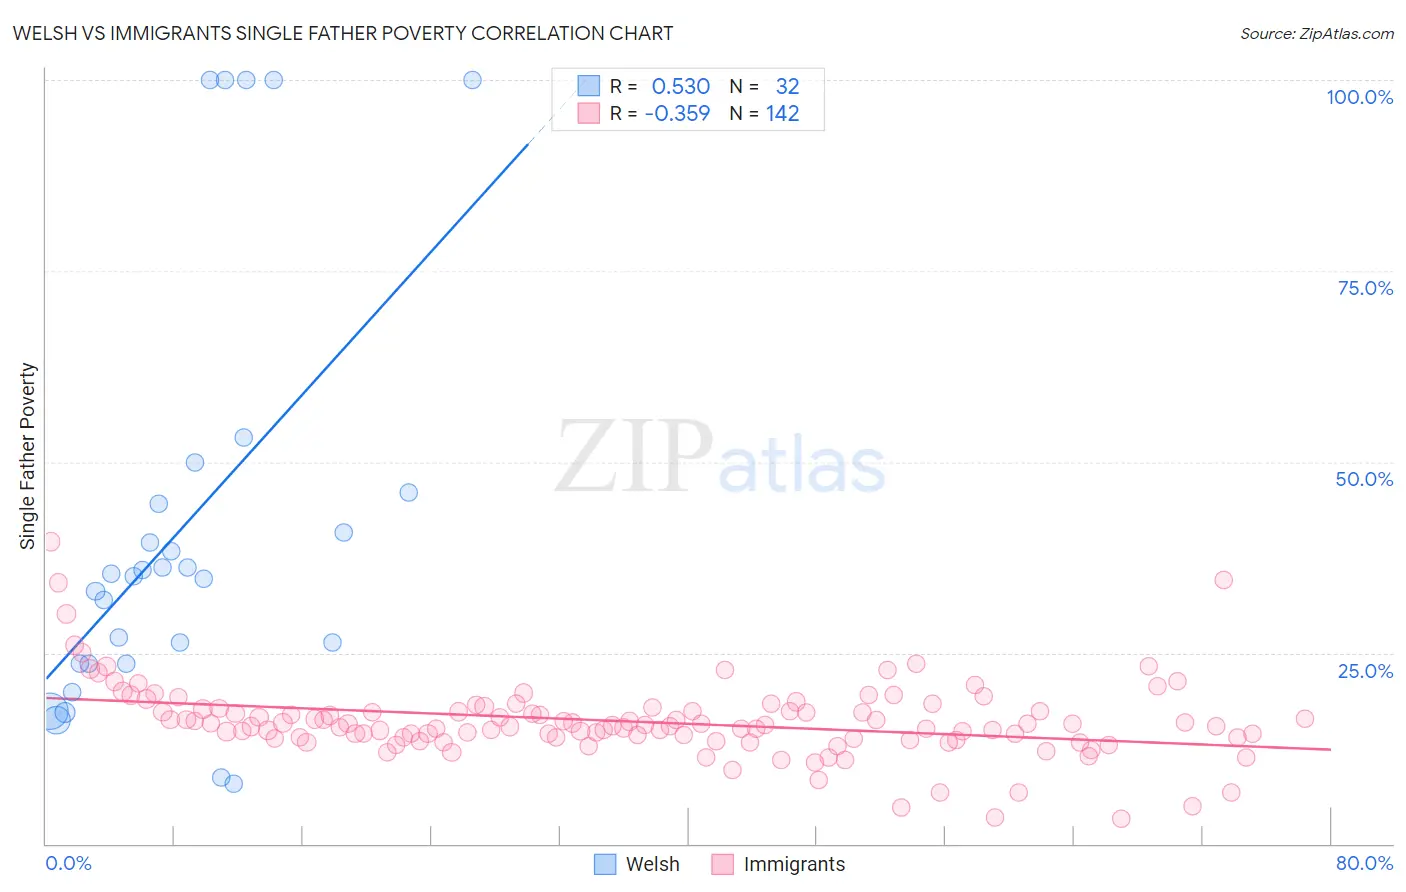
Welsh vs Immigrants Single Father Poverty Correlation Chart
The statistical analysis conducted on geographies consisting of 385,351,851 people shows a substantial positive correlation between the proportion of Welsh and poverty level among single fathers in the United States with a correlation coefficient (R) of 0.530 and weighted average of 17.8%. Similarly, the statistical analysis conducted on geographies consisting of 413,041,204 people shows a mild negative correlation between the proportion of Immigrants and poverty level among single fathers in the United States with a correlation coefficient (R) of -0.359 and weighted average of 15.9%, a difference of 12.4%.
Single Father Poverty Correlation Summary
| Measurement | Welsh | Immigrants |
| Minimum | 7.8% | 3.3% |
| Maximum | 100.0% | 39.5% |
| Range | 92.2% | 36.3% |
| Mean | 41.5% | 16.0% |
| Median | 35.2% | 15.5% |
| Interquartile 25% (IQ1) | 23.6% | 13.9% |
| Interquartile 75% (IQ3) | 45.3% | 17.6% |
| Interquartile Range (IQR) | 21.7% | 3.8% |
| Standard Deviation (Sample) | 27.8% | 5.0% |
| Standard Deviation (Population) | 27.3% | 5.0% |
Similar Demographics by Single Father Poverty
Demographics Similar to Welsh by Single Father Poverty
In terms of single father poverty, the demographic groups most similar to Welsh are Alsatian (17.8%, a difference of 0.020%), Dutch (17.8%, a difference of 0.11%), English (17.8%, a difference of 0.12%), Immigrants from Lebanon (17.9%, a difference of 0.37%), and Scottish (17.7%, a difference of 0.43%).
| Demographics | Rating | Rank | Single Father Poverty |
| Lebanese | 0.0 /100 | #277 | Tragic 17.7% |
| Germans | 0.0 /100 | #278 | Tragic 17.7% |
| Iroquois | 0.0 /100 | #279 | Tragic 17.7% |
| Scottish | 0.0 /100 | #280 | Tragic 17.7% |
| English | 0.0 /100 | #281 | Tragic 17.8% |
| Dutch | 0.0 /100 | #282 | Tragic 17.8% |
| Alsatians | 0.0 /100 | #283 | Tragic 17.8% |
| Welsh | 0.0 /100 | #284 | Tragic 17.8% |
| Immigrants | Lebanon | 0.0 /100 | #285 | Tragic 17.9% |
| Immigrants | North Macedonia | 0.0 /100 | #286 | Tragic 17.9% |
| Carpatho Rusyns | 0.0 /100 | #287 | Tragic 18.0% |
| Bahamians | 0.0 /100 | #288 | Tragic 18.0% |
| Irish | 0.0 /100 | #289 | Tragic 18.0% |
| West Indians | 0.0 /100 | #290 | Tragic 18.0% |
| Alaskan Athabascans | 0.0 /100 | #291 | Tragic 18.1% |
Demographics Similar to Immigrants by Single Father Poverty
In terms of single father poverty, the demographic groups most similar to Immigrants are Uruguayan (15.9%, a difference of 0.020%), Sudanese (15.9%, a difference of 0.060%), Immigrants from Belarus (15.8%, a difference of 0.080%), Immigrants from Eastern Europe (15.8%, a difference of 0.090%), and Palestinian (15.9%, a difference of 0.10%).
| Demographics | Rating | Rank | Single Father Poverty |
| Argentineans | 94.4 /100 | #114 | Exceptional 15.8% |
| Immigrants | Thailand | 93.6 /100 | #115 | Exceptional 15.8% |
| Immigrants | Argentina | 92.8 /100 | #116 | Exceptional 15.8% |
| Immigrants | Colombia | 92.6 /100 | #117 | Exceptional 15.8% |
| Immigrants | Eastern Europe | 92.5 /100 | #118 | Exceptional 15.8% |
| Immigrants | Belarus | 92.4 /100 | #119 | Exceptional 15.8% |
| Uruguayans | 92.1 /100 | #120 | Exceptional 15.9% |
| Immigrants | Immigrants | 91.9 /100 | #121 | Exceptional 15.9% |
| Sudanese | 91.6 /100 | #122 | Exceptional 15.9% |
| Palestinians | 91.3 /100 | #123 | Exceptional 15.9% |
| Immigrants | Panama | 91.3 /100 | #124 | Exceptional 15.9% |
| Iraqis | 91.2 /100 | #125 | Exceptional 15.9% |
| Hmong | 91.1 /100 | #126 | Exceptional 15.9% |
| Immigrants | Liberia | 91.1 /100 | #127 | Exceptional 15.9% |
| Immigrants | Nigeria | 90.8 /100 | #128 | Exceptional 15.9% |