Ute vs Ecuadorian Child Poverty Among Girls Under 16
COMPARE
Ute
Ecuadorian
Child Poverty Among Girls Under 16
Child Poverty Among Girls Under 16 Comparison
Ute
Ecuadorians
21.8%
CHILD POVERTY AMONG GIRLS UNDER 16
0.0/ 100
METRIC RATING
315th/ 347
METRIC RANK
18.8%
CHILD POVERTY AMONG GIRLS UNDER 16
0.7/ 100
METRIC RATING
244th/ 347
METRIC RANK
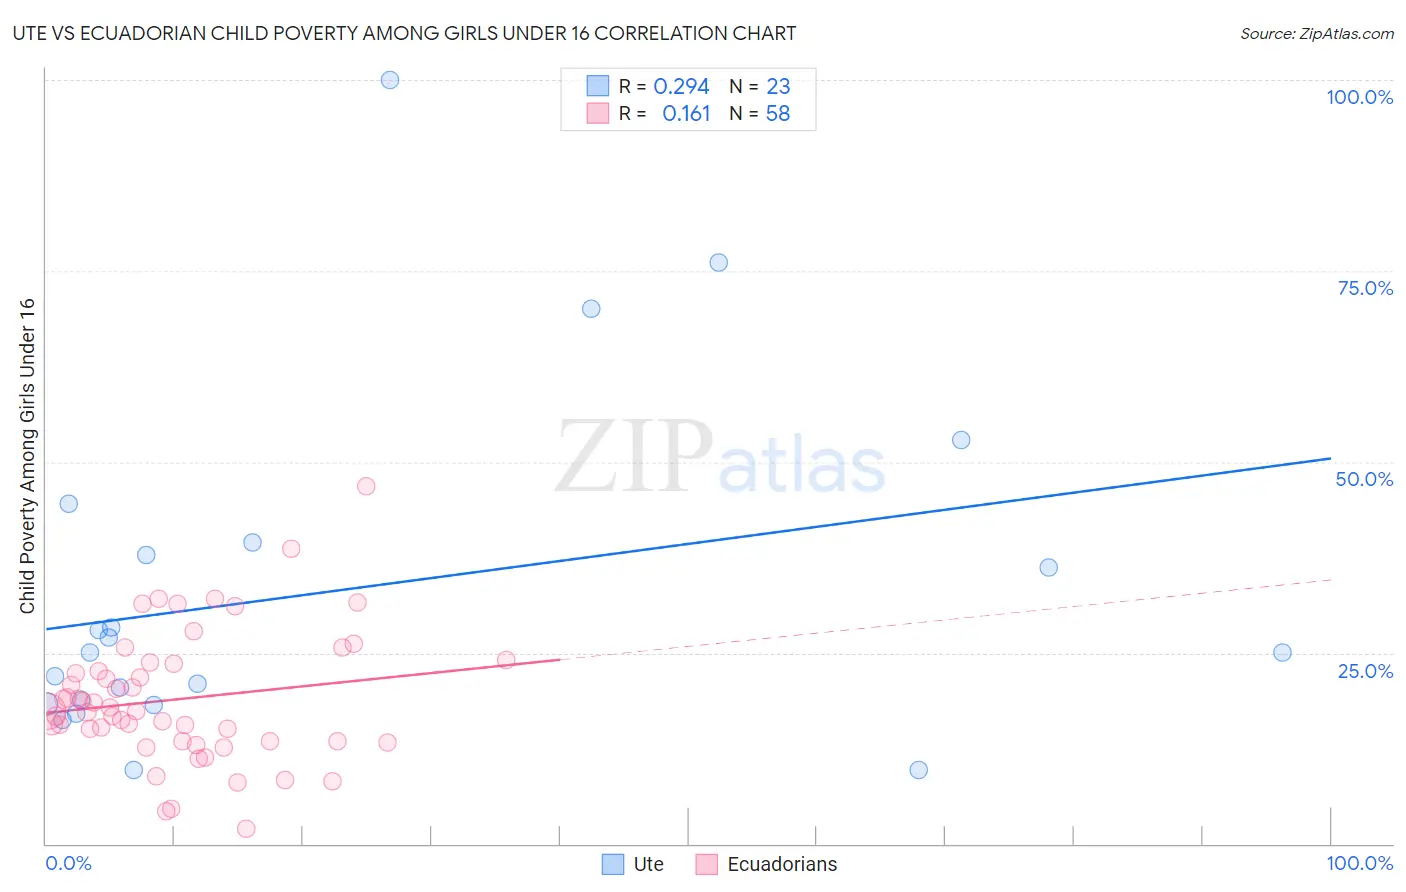
Ute vs Ecuadorian Child Poverty Among Girls Under 16 Correlation Chart
The statistical analysis conducted on geographies consisting of 55,563,406 people shows a weak positive correlation between the proportion of Ute and poverty level among girls under the age of 16 in the United States with a correlation coefficient (R) of 0.294 and weighted average of 21.8%. Similarly, the statistical analysis conducted on geographies consisting of 313,275,748 people shows a poor positive correlation between the proportion of Ecuadorians and poverty level among girls under the age of 16 in the United States with a correlation coefficient (R) of 0.161 and weighted average of 18.8%, a difference of 15.7%.
Child Poverty Among Girls Under 16 Correlation Summary
| Measurement | Ute | Ecuadorian |
| Minimum | 9.6% | 1.9% |
| Maximum | 100.0% | 46.8% |
| Range | 90.4% | 44.9% |
| Mean | 33.1% | 18.9% |
| Median | 25.0% | 17.3% |
| Interquartile 25% (IQ1) | 18.3% | 13.4% |
| Interquartile 75% (IQ3) | 39.5% | 23.5% |
| Interquartile Range (IQR) | 21.2% | 10.1% |
| Standard Deviation (Sample) | 22.6% | 8.5% |
| Standard Deviation (Population) | 22.1% | 8.4% |
Similar Demographics by Child Poverty Among Girls Under 16
Demographics Similar to Ute by Child Poverty Among Girls Under 16
In terms of child poverty among girls under 16, the demographic groups most similar to Ute are Immigrants from Guatemala (21.9%, a difference of 0.27%), Arapaho (21.7%, a difference of 0.28%), Creek (21.7%, a difference of 0.29%), African (21.9%, a difference of 0.59%), and Immigrants from Mexico (21.6%, a difference of 0.80%).
| Demographics | Rating | Rank | Child Poverty Among Girls Under 16 |
| Houma | 0.0 /100 | #308 | Tragic 21.5% |
| Bahamians | 0.0 /100 | #309 | Tragic 21.5% |
| Immigrants | Somalia | 0.0 /100 | #310 | Tragic 21.6% |
| Dutch West Indians | 0.0 /100 | #311 | Tragic 21.6% |
| Immigrants | Mexico | 0.0 /100 | #312 | Tragic 21.6% |
| Creek | 0.0 /100 | #313 | Tragic 21.7% |
| Arapaho | 0.0 /100 | #314 | Tragic 21.7% |
| Ute | 0.0 /100 | #315 | Tragic 21.8% |
| Immigrants | Guatemala | 0.0 /100 | #316 | Tragic 21.9% |
| Africans | 0.0 /100 | #317 | Tragic 21.9% |
| Immigrants | Dominica | 0.0 /100 | #318 | Tragic 22.1% |
| U.S. Virgin Islanders | 0.0 /100 | #319 | Tragic 22.1% |
| Hondurans | 0.0 /100 | #320 | Tragic 22.2% |
| Colville | 0.0 /100 | #321 | Tragic 22.5% |
| Yakama | 0.0 /100 | #322 | Tragic 22.6% |
Demographics Similar to Ecuadorians by Child Poverty Among Girls Under 16
In terms of child poverty among girls under 16, the demographic groups most similar to Ecuadorians are Immigrants from Nicaragua (18.8%, a difference of 0.070%), Shoshone (18.9%, a difference of 0.12%), Immigrants from Laos (18.9%, a difference of 0.14%), Immigrants from Cuba (18.8%, a difference of 0.28%), and American (18.8%, a difference of 0.43%).
| Demographics | Rating | Rank | Child Poverty Among Girls Under 16 |
| Immigrants | Nigeria | 1.0 /100 | #237 | Tragic 18.6% |
| Immigrants | Eritrea | 1.0 /100 | #238 | Tragic 18.7% |
| Marshallese | 0.9 /100 | #239 | Tragic 18.7% |
| Nigerians | 0.9 /100 | #240 | Tragic 18.7% |
| Americans | 0.8 /100 | #241 | Tragic 18.8% |
| Immigrants | Cuba | 0.7 /100 | #242 | Tragic 18.8% |
| Immigrants | Nicaragua | 0.7 /100 | #243 | Tragic 18.8% |
| Ecuadorians | 0.7 /100 | #244 | Tragic 18.8% |
| Shoshone | 0.6 /100 | #245 | Tragic 18.9% |
| Immigrants | Laos | 0.6 /100 | #246 | Tragic 18.9% |
| Immigrants | Ghana | 0.5 /100 | #247 | Tragic 18.9% |
| French American Indians | 0.3 /100 | #248 | Tragic 19.2% |
| Potawatomi | 0.3 /100 | #249 | Tragic 19.2% |
| Cape Verdeans | 0.3 /100 | #250 | Tragic 19.2% |
| Immigrants | Trinidad and Tobago | 0.3 /100 | #251 | Tragic 19.2% |