Immigrants from Israel vs Ecuadorian Child Poverty Among Girls Under 16
COMPARE
Immigrants from Israel
Ecuadorian
Child Poverty Among Girls Under 16
Child Poverty Among Girls Under 16 Comparison
Immigrants from Israel
Ecuadorians
14.2%
CHILD POVERTY AMONG GIRLS UNDER 16
99.2/ 100
METRIC RATING
50th/ 347
METRIC RANK
18.8%
CHILD POVERTY AMONG GIRLS UNDER 16
0.7/ 100
METRIC RATING
244th/ 347
METRIC RANK
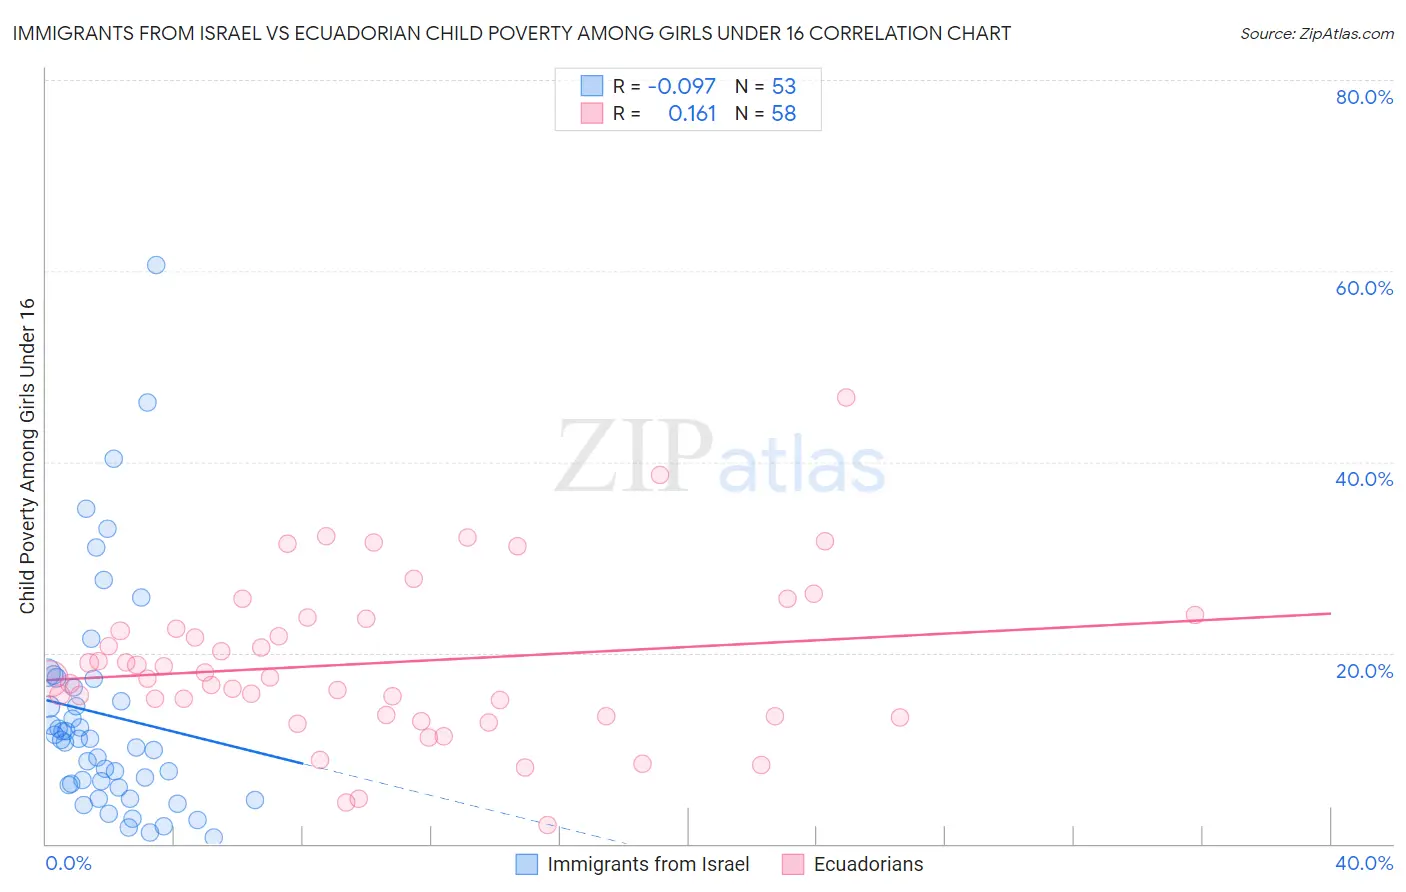
Immigrants from Israel vs Ecuadorian Child Poverty Among Girls Under 16 Correlation Chart
The statistical analysis conducted on geographies consisting of 206,961,742 people shows a slight negative correlation between the proportion of Immigrants from Israel and poverty level among girls under the age of 16 in the United States with a correlation coefficient (R) of -0.097 and weighted average of 14.2%. Similarly, the statistical analysis conducted on geographies consisting of 313,275,748 people shows a poor positive correlation between the proportion of Ecuadorians and poverty level among girls under the age of 16 in the United States with a correlation coefficient (R) of 0.161 and weighted average of 18.8%, a difference of 33.0%.
Child Poverty Among Girls Under 16 Correlation Summary
| Measurement | Immigrants from Israel | Ecuadorian |
| Minimum | 0.66% | 1.9% |
| Maximum | 60.7% | 46.8% |
| Range | 60.0% | 44.9% |
| Mean | 13.5% | 18.9% |
| Median | 10.9% | 17.3% |
| Interquartile 25% (IQ1) | 6.0% | 13.4% |
| Interquartile 75% (IQ3) | 16.9% | 23.5% |
| Interquartile Range (IQR) | 10.8% | 10.1% |
| Standard Deviation (Sample) | 12.0% | 8.5% |
| Standard Deviation (Population) | 11.9% | 8.4% |
Similar Demographics by Child Poverty Among Girls Under 16
Demographics Similar to Immigrants from Israel by Child Poverty Among Girls Under 16
In terms of child poverty among girls under 16, the demographic groups most similar to Immigrants from Israel are Greek (14.2%, a difference of 0.070%), Czech (14.2%, a difference of 0.11%), Immigrants from Czechoslovakia (14.2%, a difference of 0.12%), Croatian (14.1%, a difference of 0.15%), and Immigrants from Greece (14.1%, a difference of 0.18%).
| Demographics | Rating | Rank | Child Poverty Among Girls Under 16 |
| Koreans | 99.4 /100 | #43 | Exceptional 14.1% |
| Immigrants | Asia | 99.4 /100 | #44 | Exceptional 14.1% |
| Immigrants | Greece | 99.3 /100 | #45 | Exceptional 14.1% |
| Croatians | 99.3 /100 | #46 | Exceptional 14.1% |
| Immigrants | Czechoslovakia | 99.3 /100 | #47 | Exceptional 14.2% |
| Czechs | 99.3 /100 | #48 | Exceptional 14.2% |
| Greeks | 99.2 /100 | #49 | Exceptional 14.2% |
| Immigrants | Israel | 99.2 /100 | #50 | Exceptional 14.2% |
| Immigrants | Pakistan | 99.1 /100 | #51 | Exceptional 14.2% |
| Italians | 99.1 /100 | #52 | Exceptional 14.3% |
| Luxembourgers | 99.0 /100 | #53 | Exceptional 14.3% |
| Estonians | 98.9 /100 | #54 | Exceptional 14.3% |
| Immigrants | Romania | 98.9 /100 | #55 | Exceptional 14.3% |
| Immigrants | Indonesia | 98.9 /100 | #56 | Exceptional 14.4% |
| Immigrants | Serbia | 98.9 /100 | #57 | Exceptional 14.4% |
Demographics Similar to Ecuadorians by Child Poverty Among Girls Under 16
In terms of child poverty among girls under 16, the demographic groups most similar to Ecuadorians are Immigrants from Nicaragua (18.8%, a difference of 0.070%), Shoshone (18.9%, a difference of 0.12%), Immigrants from Laos (18.9%, a difference of 0.14%), Immigrants from Cuba (18.8%, a difference of 0.28%), and American (18.8%, a difference of 0.43%).
| Demographics | Rating | Rank | Child Poverty Among Girls Under 16 |
| Immigrants | Nigeria | 1.0 /100 | #237 | Tragic 18.6% |
| Immigrants | Eritrea | 1.0 /100 | #238 | Tragic 18.7% |
| Marshallese | 0.9 /100 | #239 | Tragic 18.7% |
| Nigerians | 0.9 /100 | #240 | Tragic 18.7% |
| Americans | 0.8 /100 | #241 | Tragic 18.8% |
| Immigrants | Cuba | 0.7 /100 | #242 | Tragic 18.8% |
| Immigrants | Nicaragua | 0.7 /100 | #243 | Tragic 18.8% |
| Ecuadorians | 0.7 /100 | #244 | Tragic 18.8% |
| Shoshone | 0.6 /100 | #245 | Tragic 18.9% |
| Immigrants | Laos | 0.6 /100 | #246 | Tragic 18.9% |
| Immigrants | Ghana | 0.5 /100 | #247 | Tragic 18.9% |
| French American Indians | 0.3 /100 | #248 | Tragic 19.2% |
| Potawatomi | 0.3 /100 | #249 | Tragic 19.2% |
| Cape Verdeans | 0.3 /100 | #250 | Tragic 19.2% |
| Immigrants | Trinidad and Tobago | 0.3 /100 | #251 | Tragic 19.2% |