Ute vs Belgian Child Poverty Among Girls Under 16
COMPARE
Ute
Belgian
Child Poverty Among Girls Under 16
Child Poverty Among Girls Under 16 Comparison
Ute
Belgians
21.8%
CHILD POVERTY AMONG GIRLS UNDER 16
0.0/ 100
METRIC RATING
315th/ 347
METRIC RANK
15.2%
CHILD POVERTY AMONG GIRLS UNDER 16
93.9/ 100
METRIC RATING
115th/ 347
METRIC RANK
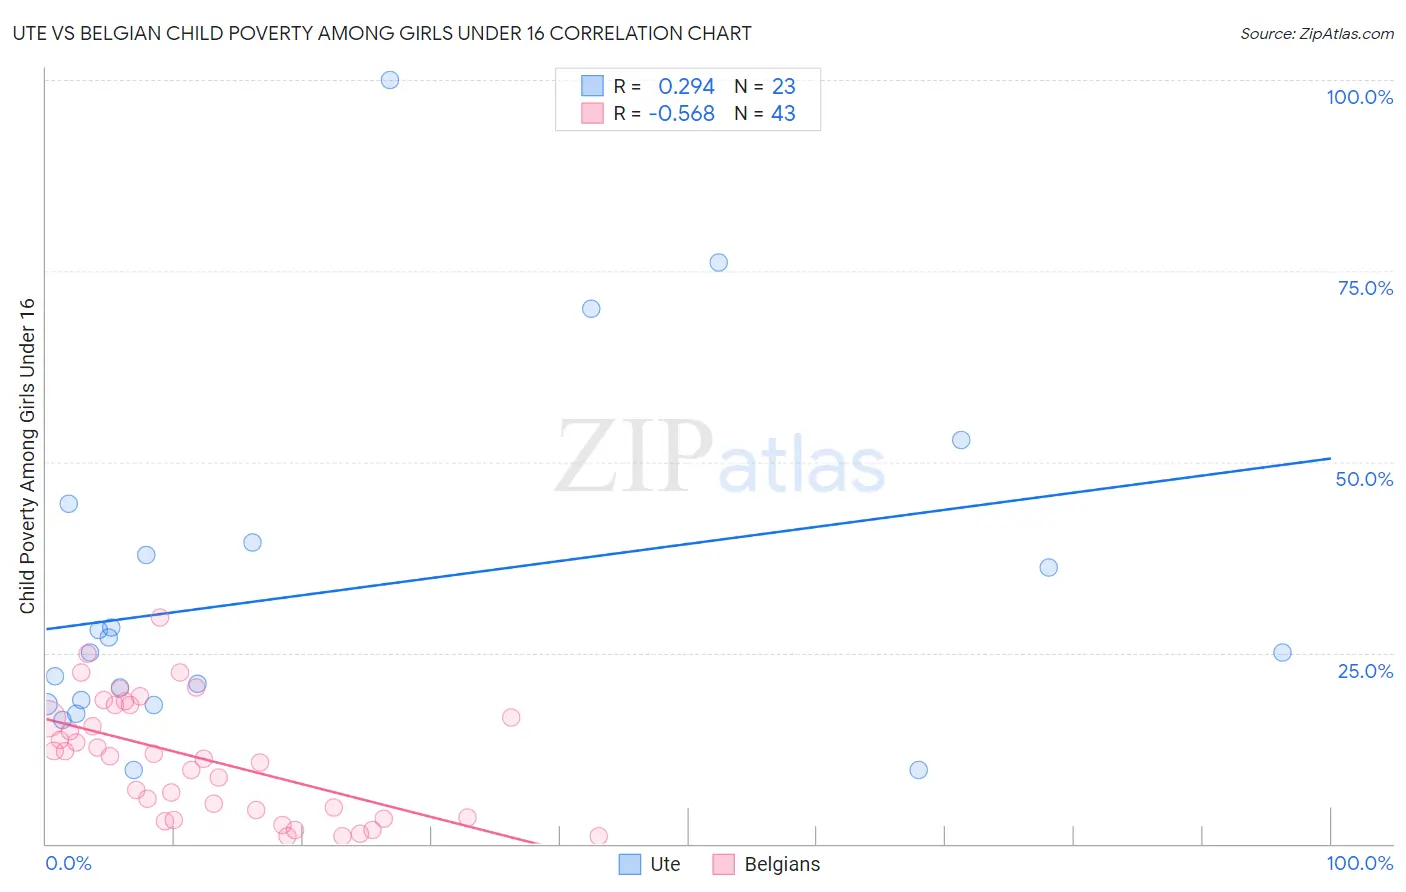
Ute vs Belgian Child Poverty Among Girls Under 16 Correlation Chart
The statistical analysis conducted on geographies consisting of 55,563,406 people shows a weak positive correlation between the proportion of Ute and poverty level among girls under the age of 16 in the United States with a correlation coefficient (R) of 0.294 and weighted average of 21.8%. Similarly, the statistical analysis conducted on geographies consisting of 348,783,790 people shows a substantial negative correlation between the proportion of Belgians and poverty level among girls under the age of 16 in the United States with a correlation coefficient (R) of -0.568 and weighted average of 15.2%, a difference of 43.7%.
Child Poverty Among Girls Under 16 Correlation Summary
| Measurement | Ute | Belgian |
| Minimum | 9.6% | 0.93% |
| Maximum | 100.0% | 29.6% |
| Range | 90.4% | 28.6% |
| Mean | 33.1% | 11.2% |
| Median | 25.0% | 11.4% |
| Interquartile 25% (IQ1) | 18.3% | 3.4% |
| Interquartile 75% (IQ3) | 39.5% | 18.2% |
| Interquartile Range (IQR) | 21.2% | 14.8% |
| Standard Deviation (Sample) | 22.6% | 7.6% |
| Standard Deviation (Population) | 22.1% | 7.5% |
Similar Demographics by Child Poverty Among Girls Under 16
Demographics Similar to Ute by Child Poverty Among Girls Under 16
In terms of child poverty among girls under 16, the demographic groups most similar to Ute are Immigrants from Guatemala (21.9%, a difference of 0.27%), Arapaho (21.7%, a difference of 0.28%), Creek (21.7%, a difference of 0.29%), African (21.9%, a difference of 0.59%), and Immigrants from Mexico (21.6%, a difference of 0.80%).
| Demographics | Rating | Rank | Child Poverty Among Girls Under 16 |
| Houma | 0.0 /100 | #308 | Tragic 21.5% |
| Bahamians | 0.0 /100 | #309 | Tragic 21.5% |
| Immigrants | Somalia | 0.0 /100 | #310 | Tragic 21.6% |
| Dutch West Indians | 0.0 /100 | #311 | Tragic 21.6% |
| Immigrants | Mexico | 0.0 /100 | #312 | Tragic 21.6% |
| Creek | 0.0 /100 | #313 | Tragic 21.7% |
| Arapaho | 0.0 /100 | #314 | Tragic 21.7% |
| Ute | 0.0 /100 | #315 | Tragic 21.8% |
| Immigrants | Guatemala | 0.0 /100 | #316 | Tragic 21.9% |
| Africans | 0.0 /100 | #317 | Tragic 21.9% |
| Immigrants | Dominica | 0.0 /100 | #318 | Tragic 22.1% |
| U.S. Virgin Islanders | 0.0 /100 | #319 | Tragic 22.1% |
| Hondurans | 0.0 /100 | #320 | Tragic 22.2% |
| Colville | 0.0 /100 | #321 | Tragic 22.5% |
| Yakama | 0.0 /100 | #322 | Tragic 22.6% |
Demographics Similar to Belgians by Child Poverty Among Girls Under 16
In terms of child poverty among girls under 16, the demographic groups most similar to Belgians are Sri Lankan (15.2%, a difference of 0.060%), Dutch (15.1%, a difference of 0.19%), Immigrants from Kazakhstan (15.1%, a difference of 0.21%), Immigrants from Denmark (15.2%, a difference of 0.31%), and Palestinian (15.1%, a difference of 0.35%).
| Demographics | Rating | Rank | Child Poverty Among Girls Under 16 |
| Immigrants | Brazil | 94.9 /100 | #108 | Exceptional 15.1% |
| Serbians | 94.8 /100 | #109 | Exceptional 15.1% |
| Immigrants | Croatia | 94.6 /100 | #110 | Exceptional 15.1% |
| Palestinians | 94.5 /100 | #111 | Exceptional 15.1% |
| Immigrants | Kazakhstan | 94.3 /100 | #112 | Exceptional 15.1% |
| Dutch | 94.3 /100 | #113 | Exceptional 15.1% |
| Sri Lankans | 94.0 /100 | #114 | Exceptional 15.2% |
| Belgians | 93.9 /100 | #115 | Exceptional 15.2% |
| Immigrants | Denmark | 93.3 /100 | #116 | Exceptional 15.2% |
| Immigrants | North Macedonia | 93.1 /100 | #117 | Exceptional 15.2% |
| Immigrants | Southern Europe | 92.7 /100 | #118 | Exceptional 15.3% |
| Immigrants | Zimbabwe | 92.5 /100 | #119 | Exceptional 15.3% |
| Pakistanis | 92.3 /100 | #120 | Exceptional 15.3% |
| English | 92.2 /100 | #121 | Exceptional 15.3% |
| Portuguese | 91.8 /100 | #122 | Exceptional 15.3% |