Immigrants from Hungary vs Ecuadorian Child Poverty Among Girls Under 16
COMPARE
Immigrants from Hungary
Ecuadorian
Child Poverty Among Girls Under 16
Child Poverty Among Girls Under 16 Comparison
Immigrants from Hungary
Ecuadorians
15.8%
CHILD POVERTY AMONG GIRLS UNDER 16
80.9/ 100
METRIC RATING
149th/ 347
METRIC RANK
18.8%
CHILD POVERTY AMONG GIRLS UNDER 16
0.7/ 100
METRIC RATING
244th/ 347
METRIC RANK
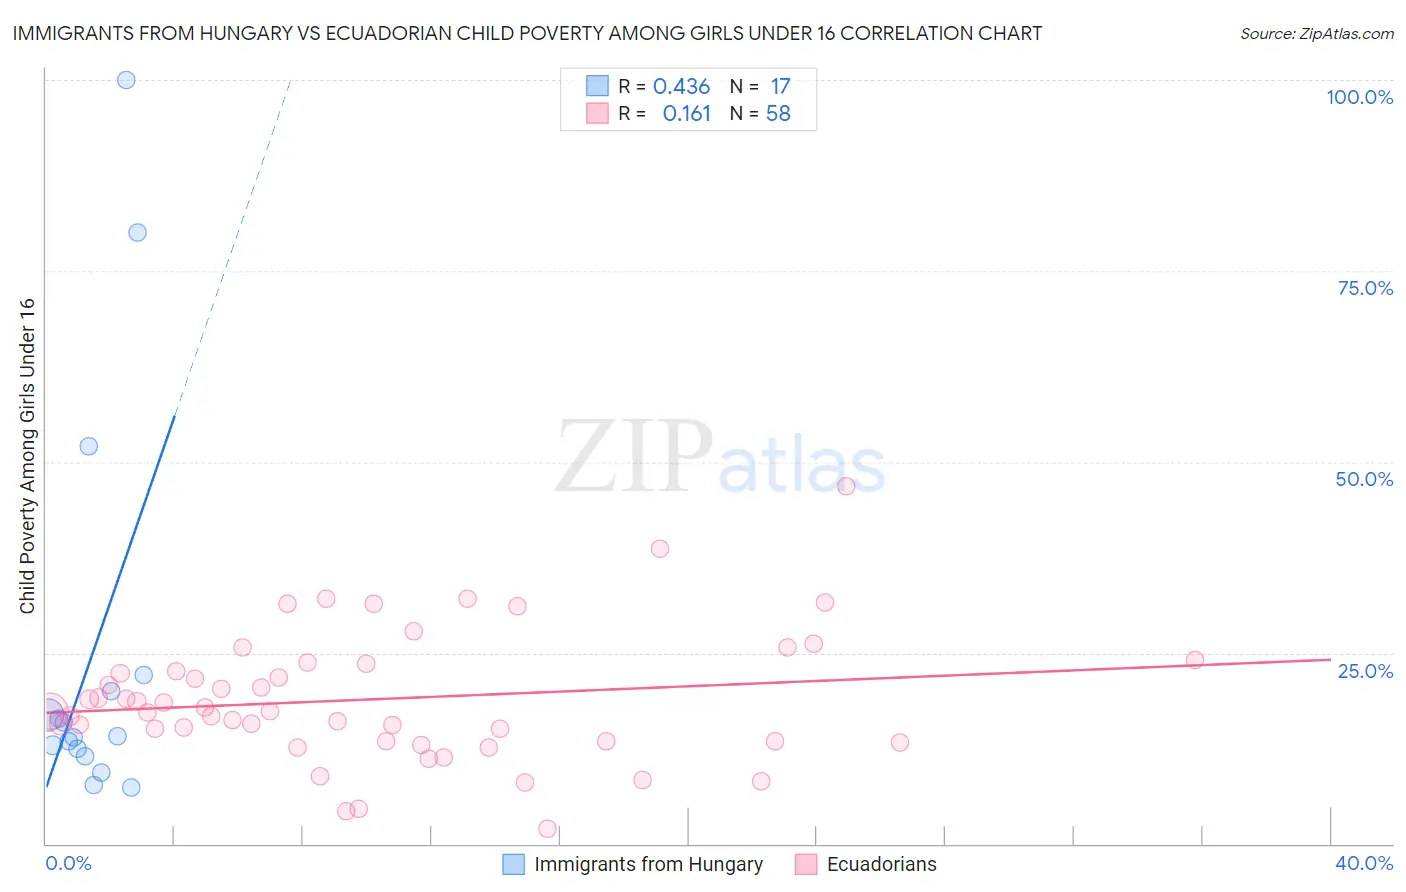
Immigrants from Hungary vs Ecuadorian Child Poverty Among Girls Under 16 Correlation Chart
The statistical analysis conducted on geographies consisting of 193,307,039 people shows a moderate positive correlation between the proportion of Immigrants from Hungary and poverty level among girls under the age of 16 in the United States with a correlation coefficient (R) of 0.436 and weighted average of 15.8%. Similarly, the statistical analysis conducted on geographies consisting of 313,275,748 people shows a poor positive correlation between the proportion of Ecuadorians and poverty level among girls under the age of 16 in the United States with a correlation coefficient (R) of 0.161 and weighted average of 18.8%, a difference of 19.4%.
Child Poverty Among Girls Under 16 Correlation Summary
| Measurement | Immigrants from Hungary | Ecuadorian |
| Minimum | 7.3% | 1.9% |
| Maximum | 100.0% | 46.8% |
| Range | 92.7% | 44.9% |
| Mean | 25.0% | 18.9% |
| Median | 14.0% | 17.3% |
| Interquartile 25% (IQ1) | 12.0% | 13.4% |
| Interquartile 75% (IQ3) | 21.1% | 23.5% |
| Interquartile Range (IQR) | 9.1% | 10.1% |
| Standard Deviation (Sample) | 26.6% | 8.5% |
| Standard Deviation (Population) | 25.9% | 8.4% |
Similar Demographics by Child Poverty Among Girls Under 16
Demographics Similar to Immigrants from Hungary by Child Poverty Among Girls Under 16
In terms of child poverty among girls under 16, the demographic groups most similar to Immigrants from Hungary are Immigrants from Albania (15.8%, a difference of 0.040%), Venezuelan (15.8%, a difference of 0.14%), Immigrants from Kuwait (15.8%, a difference of 0.28%), Icelander (15.7%, a difference of 0.32%), and Immigrants from Nepal (15.9%, a difference of 0.44%).
| Demographics | Rating | Rank | Child Poverty Among Girls Under 16 |
| Canadians | 87.1 /100 | #142 | Excellent 15.6% |
| Immigrants | Peru | 86.6 /100 | #143 | Excellent 15.6% |
| Israelis | 86.3 /100 | #144 | Excellent 15.6% |
| Welsh | 85.4 /100 | #145 | Excellent 15.6% |
| Samoans | 84.2 /100 | #146 | Excellent 15.7% |
| Slavs | 83.1 /100 | #147 | Excellent 15.7% |
| Icelanders | 82.4 /100 | #148 | Excellent 15.7% |
| Immigrants | Hungary | 80.9 /100 | #149 | Excellent 15.8% |
| Immigrants | Albania | 80.7 /100 | #150 | Excellent 15.8% |
| Venezuelans | 80.1 /100 | #151 | Excellent 15.8% |
| Immigrants | Kuwait | 79.4 /100 | #152 | Good 15.8% |
| Immigrants | Nepal | 78.5 /100 | #153 | Good 15.9% |
| Immigrants | Chile | 76.7 /100 | #154 | Good 15.9% |
| Syrians | 76.7 /100 | #155 | Good 15.9% |
| Immigrants | Fiji | 76.1 /100 | #156 | Good 15.9% |
Demographics Similar to Ecuadorians by Child Poverty Among Girls Under 16
In terms of child poverty among girls under 16, the demographic groups most similar to Ecuadorians are Immigrants from Nicaragua (18.8%, a difference of 0.070%), Shoshone (18.9%, a difference of 0.12%), Immigrants from Laos (18.9%, a difference of 0.14%), Immigrants from Cuba (18.8%, a difference of 0.28%), and American (18.8%, a difference of 0.43%).
| Demographics | Rating | Rank | Child Poverty Among Girls Under 16 |
| Immigrants | Nigeria | 1.0 /100 | #237 | Tragic 18.6% |
| Immigrants | Eritrea | 1.0 /100 | #238 | Tragic 18.7% |
| Marshallese | 0.9 /100 | #239 | Tragic 18.7% |
| Nigerians | 0.9 /100 | #240 | Tragic 18.7% |
| Americans | 0.8 /100 | #241 | Tragic 18.8% |
| Immigrants | Cuba | 0.7 /100 | #242 | Tragic 18.8% |
| Immigrants | Nicaragua | 0.7 /100 | #243 | Tragic 18.8% |
| Ecuadorians | 0.7 /100 | #244 | Tragic 18.8% |
| Shoshone | 0.6 /100 | #245 | Tragic 18.9% |
| Immigrants | Laos | 0.6 /100 | #246 | Tragic 18.9% |
| Immigrants | Ghana | 0.5 /100 | #247 | Tragic 18.9% |
| French American Indians | 0.3 /100 | #248 | Tragic 19.2% |
| Potawatomi | 0.3 /100 | #249 | Tragic 19.2% |
| Cape Verdeans | 0.3 /100 | #250 | Tragic 19.2% |
| Immigrants | Trinidad and Tobago | 0.3 /100 | #251 | Tragic 19.2% |