Ute vs Ecuadorian Unemployment Among Ages 20 to 24 years
COMPARE
Ute
Ecuadorian
Unemployment Among Ages 20 to 24 years
Unemployment Among Ages 20 to 24 years Comparison
Ute
Ecuadorians
11.2%
UNEMPLOYMENT AMONG AGES 20 TO 24 YEARS
0.0/ 100
METRIC RATING
269th/ 347
METRIC RANK
11.8%
UNEMPLOYMENT AMONG AGES 20 TO 24 YEARS
0.0/ 100
METRIC RATING
286th/ 347
METRIC RANK
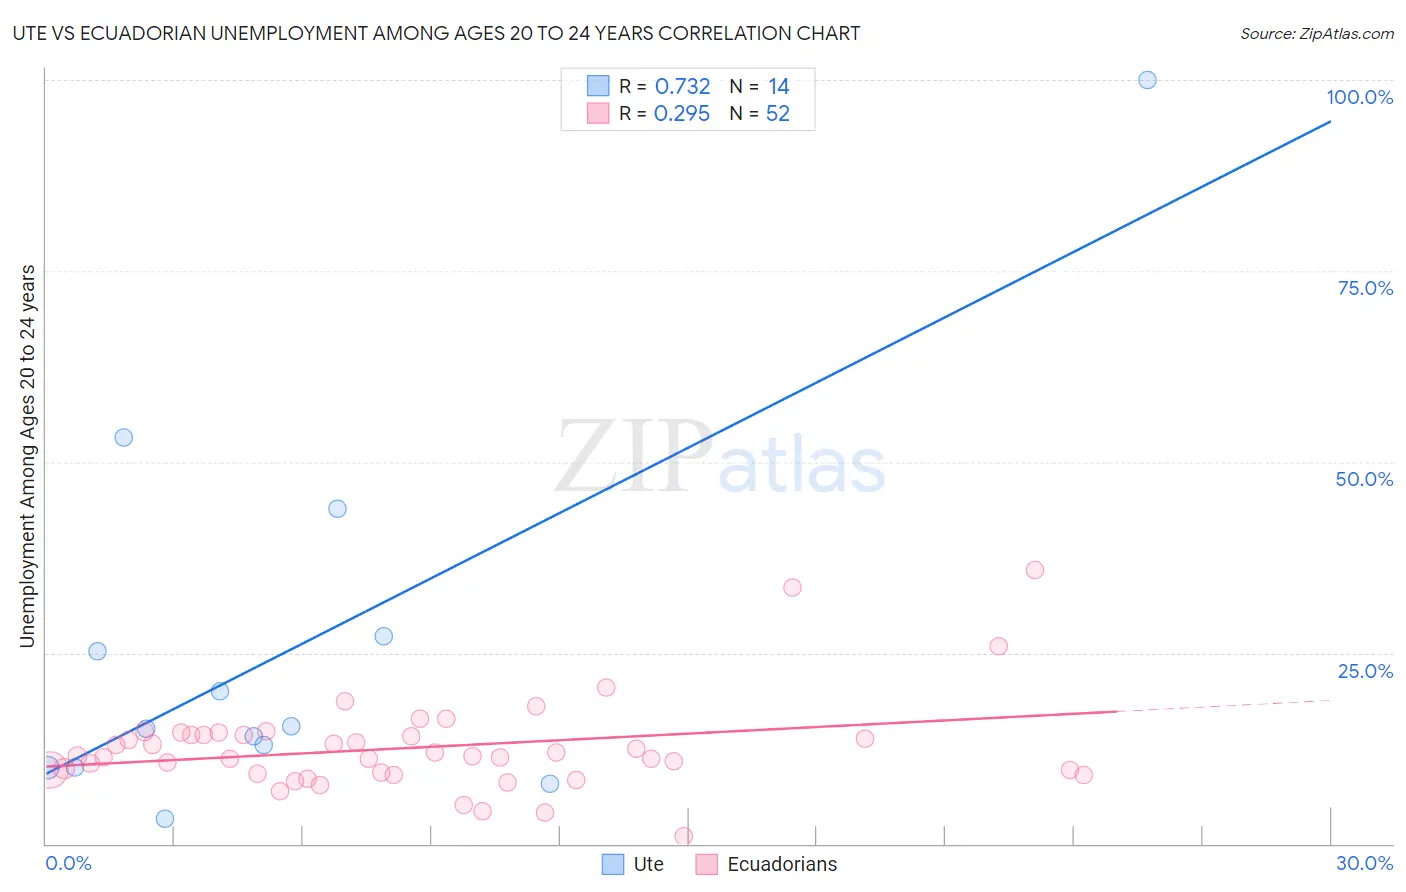
Ute vs Ecuadorian Unemployment Among Ages 20 to 24 years Correlation Chart
The statistical analysis conducted on geographies consisting of 55,243,819 people shows a strong positive correlation between the proportion of Ute and unemployment rate among population between the ages 20 and 24 in the United States with a correlation coefficient (R) of 0.732 and weighted average of 11.2%. Similarly, the statistical analysis conducted on geographies consisting of 311,775,380 people shows a weak positive correlation between the proportion of Ecuadorians and unemployment rate among population between the ages 20 and 24 in the United States with a correlation coefficient (R) of 0.295 and weighted average of 11.8%, a difference of 4.8%.
Unemployment Among Ages 20 to 24 years Correlation Summary
| Measurement | Ute | Ecuadorian |
| Minimum | 3.2% | 1.0% |
| Maximum | 100.0% | 35.9% |
| Range | 96.8% | 34.9% |
| Mean | 25.6% | 12.6% |
| Median | 15.2% | 11.4% |
| Interquartile 25% (IQ1) | 10.0% | 9.3% |
| Interquartile 75% (IQ3) | 27.1% | 14.3% |
| Interquartile Range (IQR) | 17.1% | 5.0% |
| Standard Deviation (Sample) | 25.5% | 6.1% |
| Standard Deviation (Population) | 24.6% | 6.0% |
Demographics Similar to Ute and Ecuadorians by Unemployment Among Ages 20 to 24 years
In terms of unemployment among ages 20 to 24 years, the demographic groups most similar to Ute are Maltese (11.2%, a difference of 0.39%), Delaware (11.3%, a difference of 0.58%), Immigrants from Greece (11.1%, a difference of 0.83%), Immigrants from Uzbekistan (11.4%, a difference of 1.7%), and Nigerian (11.4%, a difference of 1.7%). Similarly, the demographic groups most similar to Ecuadorians are Immigrants from Ecuador (11.8%, a difference of 0.090%), Soviet Union (11.7%, a difference of 0.12%), Immigrants from Western Africa (11.7%, a difference of 0.16%), Ghanaian (11.7%, a difference of 0.17%), and Immigrants from Cameroon (11.7%, a difference of 0.51%).
| Demographics | Rating | Rank | Unemployment Among Ages 20 to 24 years |
| Immigrants | Greece | 0.0 /100 | #267 | Tragic 11.1% |
| Maltese | 0.0 /100 | #268 | Tragic 11.2% |
| Ute | 0.0 /100 | #269 | Tragic 11.2% |
| Delaware | 0.0 /100 | #270 | Tragic 11.3% |
| Immigrants | Uzbekistan | 0.0 /100 | #271 | Tragic 11.4% |
| Nigerians | 0.0 /100 | #272 | Tragic 11.4% |
| Immigrants | Nigeria | 0.0 /100 | #273 | Tragic 11.5% |
| Cape Verdeans | 0.0 /100 | #274 | Tragic 11.5% |
| Senegalese | 0.0 /100 | #275 | Tragic 11.5% |
| Sierra Leoneans | 0.0 /100 | #276 | Tragic 11.5% |
| Africans | 0.0 /100 | #277 | Tragic 11.5% |
| Colville | 0.0 /100 | #278 | Tragic 11.6% |
| Bahamians | 0.0 /100 | #279 | Tragic 11.6% |
| Alaskan Athabascans | 0.0 /100 | #280 | Tragic 11.6% |
| Armenians | 0.0 /100 | #281 | Tragic 11.7% |
| Immigrants | Cameroon | 0.0 /100 | #282 | Tragic 11.7% |
| Ghanaians | 0.0 /100 | #283 | Tragic 11.7% |
| Immigrants | Western Africa | 0.0 /100 | #284 | Tragic 11.7% |
| Soviet Union | 0.0 /100 | #285 | Tragic 11.7% |
| Ecuadorians | 0.0 /100 | #286 | Tragic 11.8% |
| Immigrants | Ecuador | 0.0 /100 | #287 | Tragic 11.8% |